A driver training business in Farnborough, Hampshire had seen enquiries from Google slow down and wanted to know why. I pulled 16 months of Search Console data, crawled the site, checked the live results and reviewed the Google Business Profile. The report separated what was proven (visibility for towing had fallen sharply), what was likely, what was ruled out and what couldn’t be proven from the data available.
The business and its owner aren’t named, and their phone number and booking figures are left out. The Search Console figures, the town and the competitors are real. In the screenshots, the business name and owner’s name have been replaced.
What was the brief?
The owner had noticed fewer enquiries from Google and had specific questions: was it algorithm changes, rankings, demand, competition or something technical? They were looking for an investigation into the decline, not a redesign or a monthly SEO package. I had read access to Search Console and the Business Profile, and a provisional diary of bookings. There was very little else.
The gaps shaped the work. Search Console keeps 16 months of history, so the 2025 fall could be seen but nothing before it. The Business Profile’s performance page offers six months. Analytics had recorded nothing from November 2024 to the start of October 2026, and no phone tap or form send had ever been logged. Several answers could only be given for the future, and I wanted the report to say which.
How was the investigation run?
I worked through the causes in order, from the cheapest to rule out to the hardest to prove, and recorded the result of each. The sequence is the one described in why has my organic traffic dropped: confirm the drop, test demand, rule out faults, compare impressions and clicks, look at the live results, then line the timing up against updates and site changes.
In practice that meant a 16-month Search Console export by page, query and device, Google Trends for the main towing phrases going back several years, a crawl of 54 pages, URL inspection of the seven key pages, speed tests, a structured data check, and a comparison of the Business Profile with the competitors appearing in the map results. I also searched the main queries by hand and recorded what sat above the business’s listings.
What did the data show?
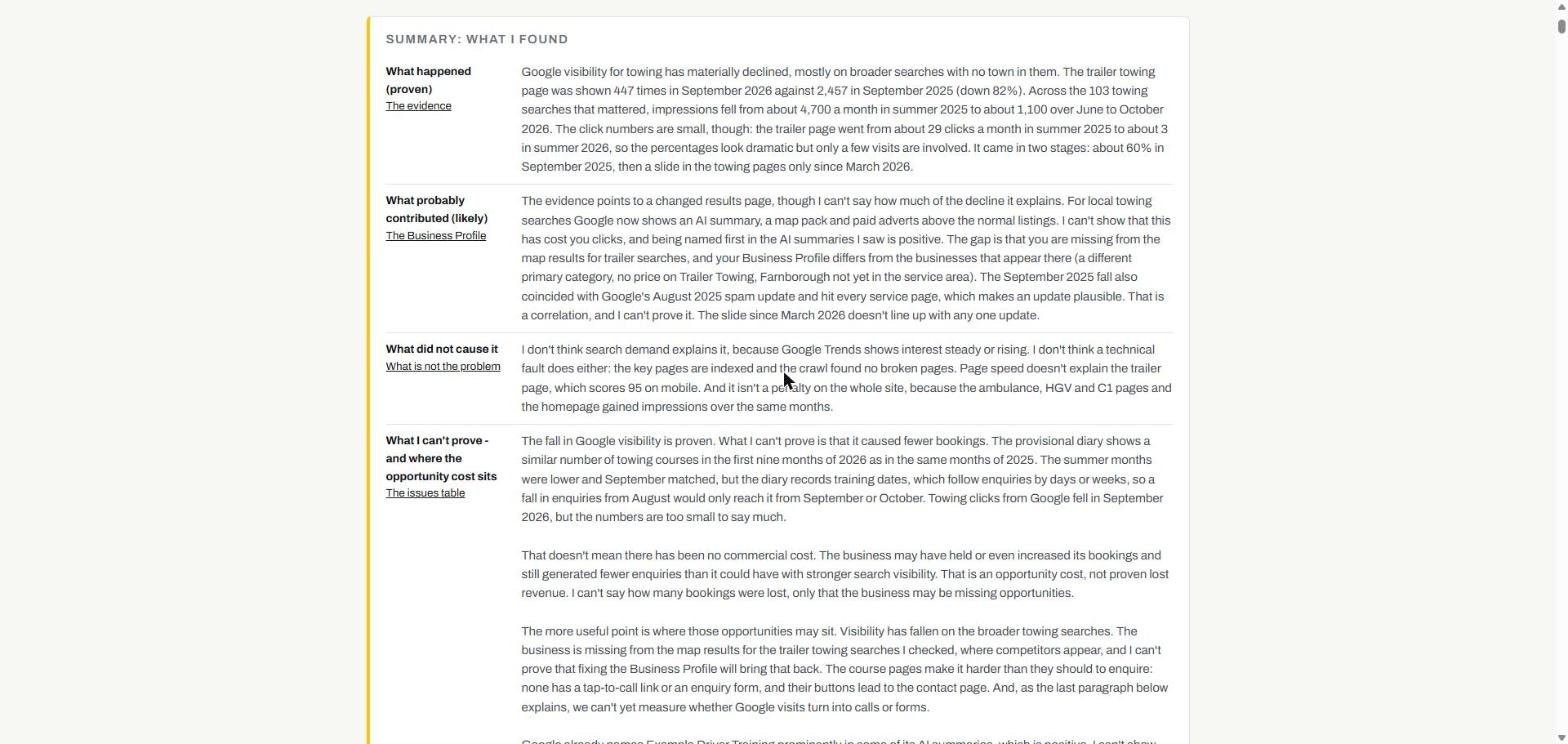
Visibility for towing had fallen sharply, in two stages, and the pages were being shown to far fewer people. The main trailer towing page appeared 447 times in one recent month against 2,457 a year earlier, a fall of 82%. Across the 103 towing searches that mattered, impressions fell from about 4,700 a month in summer 2025 to about 1,100 over the following summer and autumn.
The click numbers behind that were small. The trailer page went from about 29 clicks a month to about 3, so the percentages look dramatic but only a few visits were involved. I put that next to the percentage in the report, because an owner deciding where to spend a month needs the size of the problem as well as the direction.
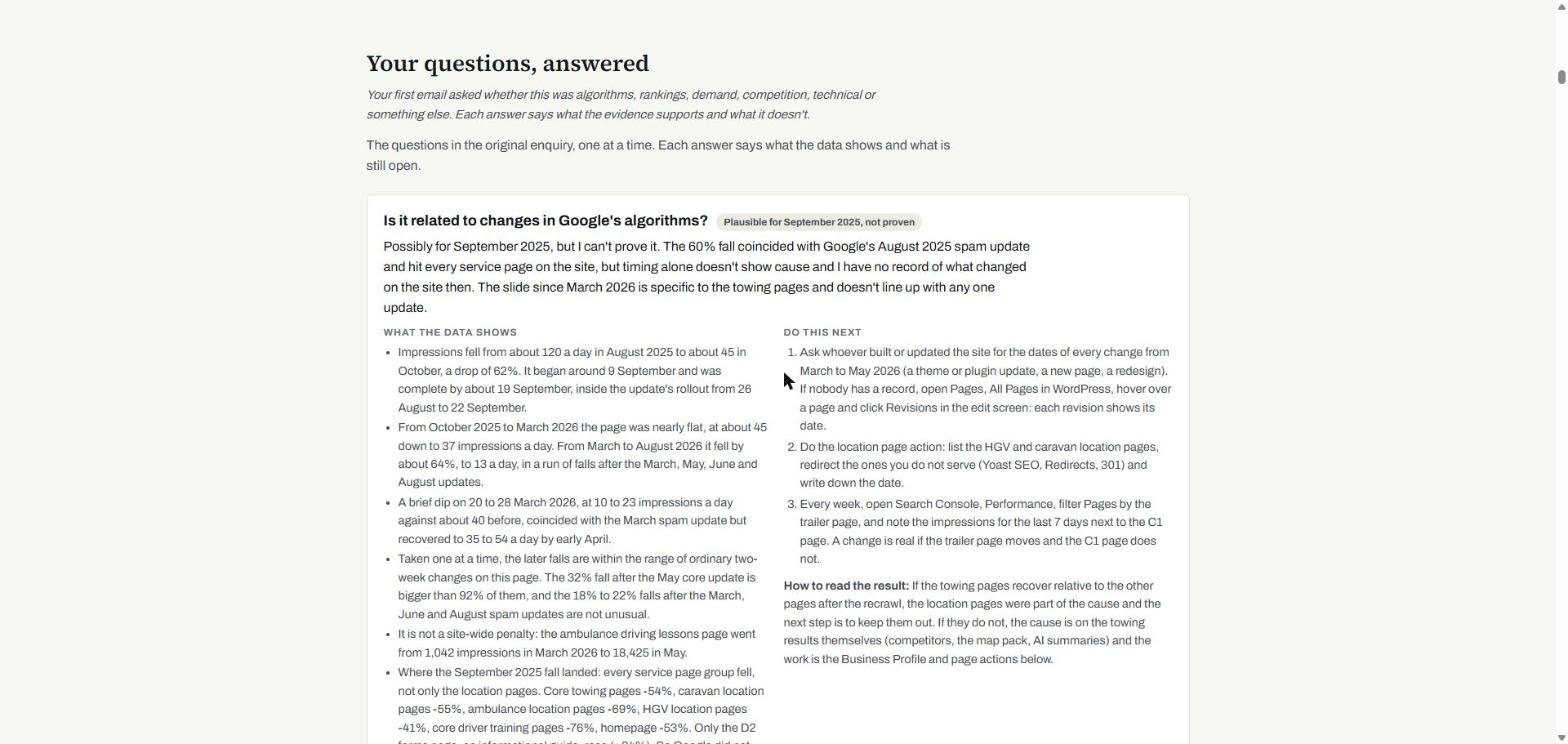
The fall came in two stages. About 60% of the impressions went over a few weeks in autumn 2025, and it hit every service page on the site, not only the towing pages. That coincided with a Google spam update, which made an update plausible. It didn’t prove one, and the report says so. A second slide from spring 2026 affected only the towing pages while the ambulance and HGV pages and the homepage gained impressions, so it wasn’t a site-wide effect.
For local towing searches, the results now showed an AI summary, a map pack and adverts above the standard listings. The business was named first in the AI summaries I saw, which was good news, but it was missing from the map results for trailer searches, where competitors appeared. Its Business Profile differed from theirs: a different primary category, no price on the towing service and a service area that hadn’t been updated.
In the live map results I checked in October 2026, the businesses that appeared for searches such as “trailer towing lessons farnborough” and “caravan towing course farnborough” included Howe To Tow and Nick Martin’s Driving School, both in Farnborough. For wider Surrey and Hampshire searches, Trailer Training UK in Winchester and Hampshire Towing in Southampton appeared as well. The client had 5.0 from 153 reviews. Nick Martin’s Driving School had 5.0 from 885 and Howe To Tow had 4.8 from 11. Howe To Tow appeared in all three map results with only 11 reviews, so reviews alone didn’t explain who got a place.
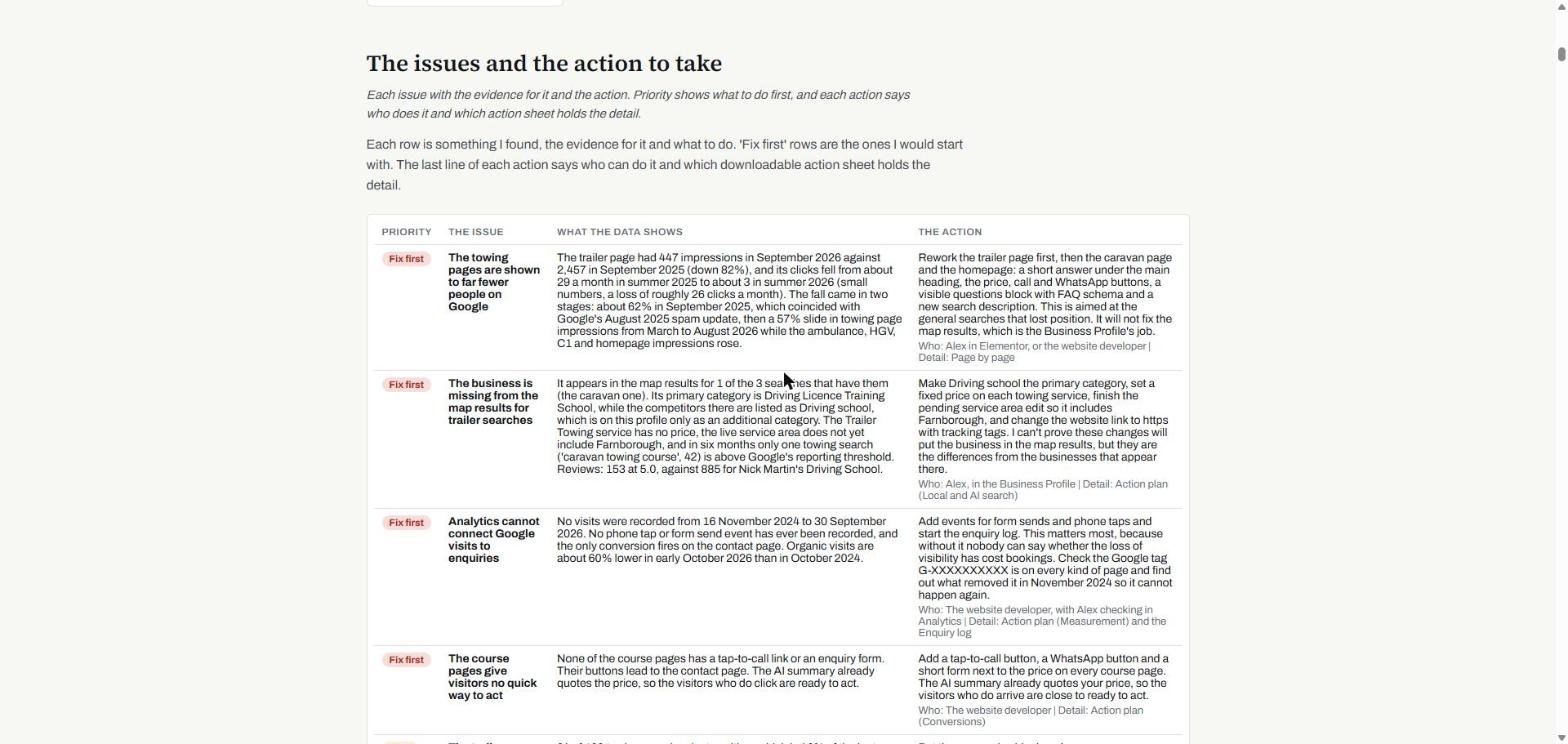
The competitors in the map results were listed as Driving school, while the client’s primary category was Driving Licence Training School. Their map entries showed a services line and a street address, and the client’s showed a review quote instead. On the search “how much is a trailer towing course”, every result on page one showed a price in its listing, and the client wasn’t on page one, although its pages state its prices. I can’t prove that matching those details would put the business in the map results, but that’s where the profiles differed.
What was ruled out?
Demand, technical faults, speed and a site-wide penalty were all set aside, which meant the work could focus on the results page, the map listing and the course pages. Demand held up: Google Trends showed interest in the main towing phrases steady or rising through 2026, though the narrower phrases the page ranked for were too small to chart. The seven key pages were indexed with the right canonical and the crawl found no broken pages.
Speed didn’t explain the trailer page, which scored 95 on mobile. A site-wide penalty looked unlikely, because other page groups gained impressions over the same months. Each is a plausible reason to spend money in the wrong place.
What couldn’t be proven?
The loss of Google visibility was proven. Whether it cost bookings was not. The provisional diary didn’t show a clear fall in towing courses, and training dates follow enquiries by days or weeks, so any effect might arrive later. Towing clicks were too few to read much into.
That doesn’t mean there was no cost. The business may have held its bookings and still received fewer enquiries than stronger visibility would have brought. I described that as an opportunity cost, not proven lost revenue, because without enquiry tracking there was no way to quantify it. None of the course pages offered a tap-to-call button or a form, so visitors who arrived had no quick way to act.
What did I recommend?
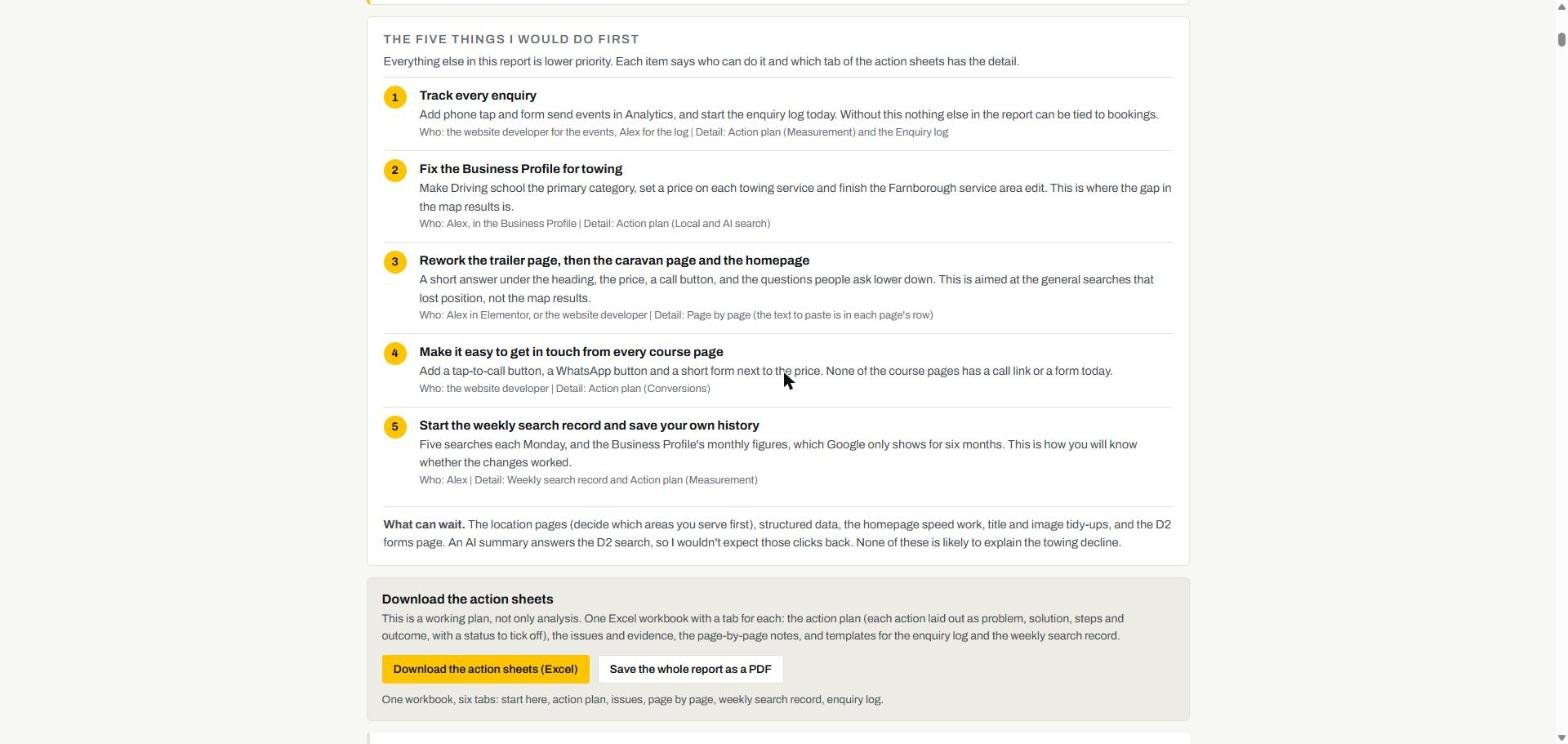
Enquiry tracking came first, because nothing else in the report could be tied to bookings without it. The five actions, in order, were:
- Record phone taps and form sends as events, and start an enquiry log.
- Fix the Business Profile for towing: the primary category, prices on each service and the service area.
- Rework the trailer page, then the caravan page and the homepage, with a short answer under the heading, the price, a call button and the questions people ask.
- Add a tap-to-call button, a WhatsApp button and a short form to every course page.
- Start a weekly record of five searches and save the Business Profile history monthly, since Google only shows six months.
The report also said what could wait: the location pages until the owner had decided which areas they actually serve, structured data, homepage speed work, title and image tidy-ups, and a page where an AI summary now answers the search and the clicks were unlikely to return.
What did the owner receive?
One page that could be read online, saved as a PDF and used as a working plan. The report opens with a summary in five parts, then the first actions to take, an issues table with the data and the action for each, and a section answering the owner’s original questions one at a time, each with a rating of how well the evidence supports it.
The same actions came as an Excel workbook with tabs for the action plan (each action laid out as problem, solution, steps and outcome), the issues and evidence, page-by-page notes, a weekly search record and an enquiry log. The report page is private and blocked from search engines. Four of the workbook’s tabs are shown below, with names changed.
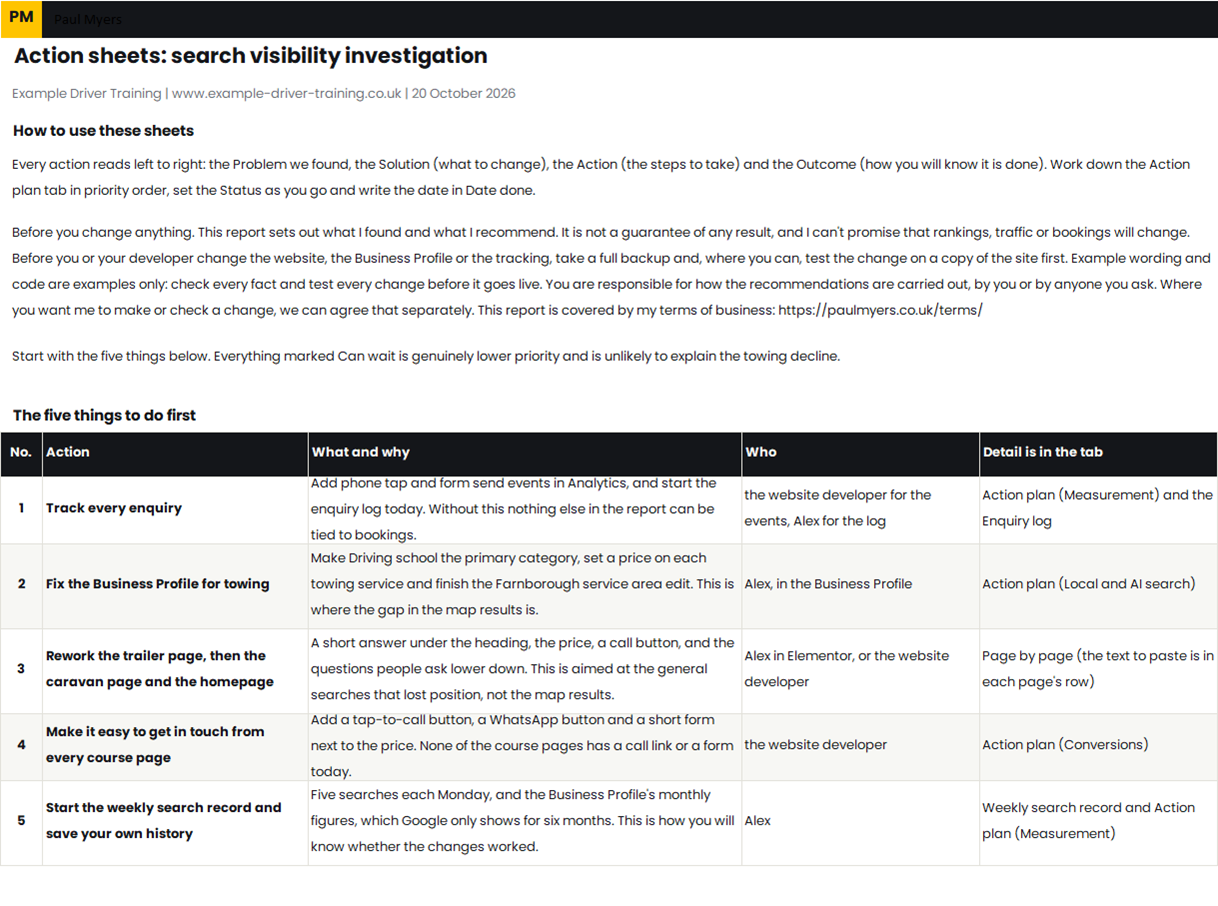

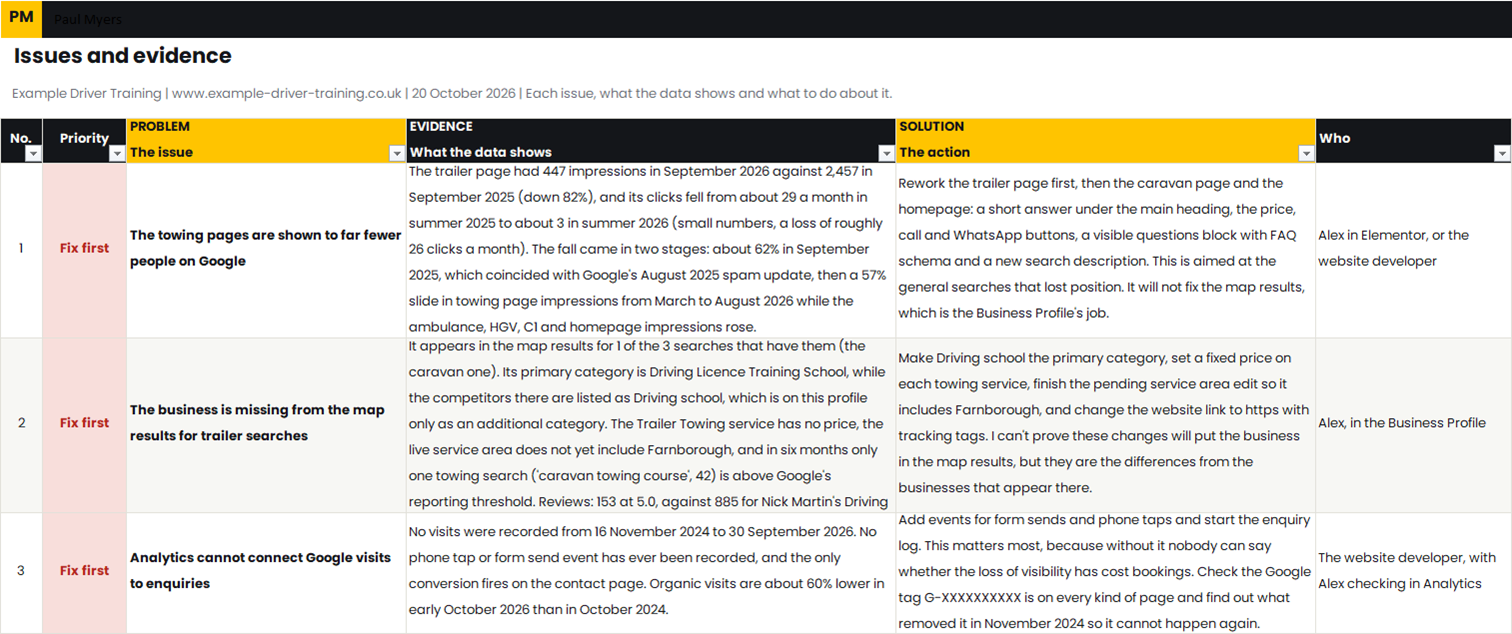
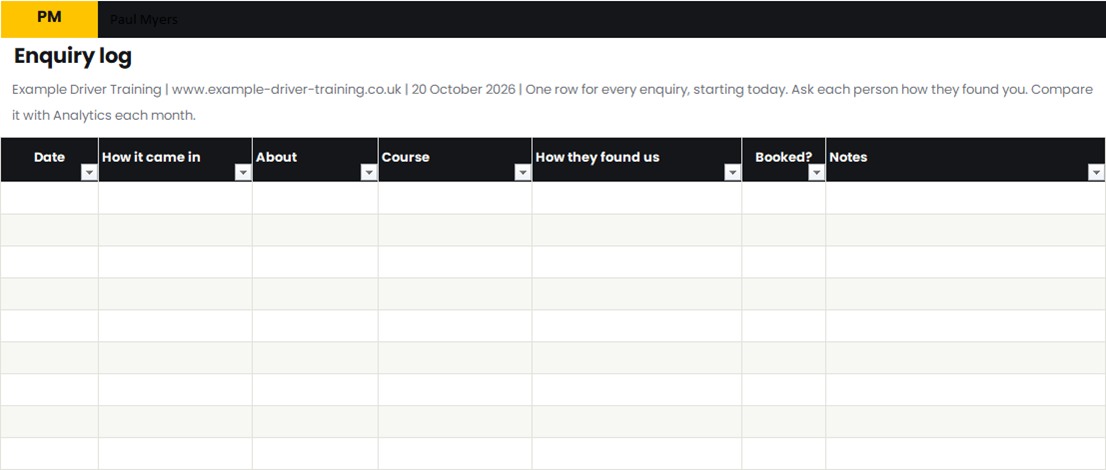
The SEO and AI search strategy
The investigation covered six areas, in this order, because each one decides whether the next is worth doing.
| Area | Aim | What it involved |
|---|---|---|
| Measurement | Know whether visibility loss cost enquiries | Found that Analytics had been blank for almost two years and that no calls or forms were recorded; set out the events and a manual enquiry log |
| Search Console analysis | Size the fall and find where it sat | 16 months by page, query and device; two stages of decline; separated small click numbers from large percentages |
| Rule-outs | Stop money going to the wrong fix | Demand, indexing, crawl faults, speed and penalty tested and set aside |
| Results page and local search | Find where visibility was being lost | Live checks of AI summaries, map results and adverts; Business Profile compared with competitors in the map pack |
| Pages and conversions | Make visits worth having | Page-by-page notes, a short answer and price under each heading, call and form options on every course page |
| AI search visibility | See whether AI summaries named the business | Checked the AI summaries on the main searches; the business was named first, which the report treated as a strength |
What the investigation couldn’t establish
Several limits stayed open, and the report listed them. Search Console starts in mid-2025 for this site, so earlier history was unavailable. The Business Profile shows six months, so the autumn 2025 fall couldn’t be compared with profile activity. The dates of edits to the site weren’t recorded, so I couldn’t tie either fall to a specific change.
The live checks were one snapshot from one browser on one day, and AI summaries and map results change from search to search. Search Console didn’t have enough traffic to report real-user page speed. Search volumes came from Google Trends, which gives direction, not numbers.
If you run a driving school or driver training business, my SEO for driving schools page explains how I work with them.
If your traffic has dropped and nobody can say why, the traffic decline investigation works the same way. You can also ask for a free assessment.