Whether your website is too slow depends on what real visitors experience, and a single PageSpeed score can’t tell you that. If you’ve run your site through PageSpeed Insights and seen amber or red, you’ve probably also been told that speed affects your rankings, usually by someone who’d like to fix it for a fee. I wanted to test that on a site I control, so this post covers what Google says about speed, what I changed on paulmyers.co.uk, what the results show and what they don’t, and how to check your own.
What I tested, and what the scores were
On 2 November 2026 I ran PageSpeed Insights on the paulmyers.co.uk homepage. The desktop report scored 100 for Performance, Accessibility, Best Practices and SEO, with Agentic Browsing at 3 out of 3. That’s one page, tested once, under Google’s lab conditions, so it describes how the page is built and not what every visitor experiences.
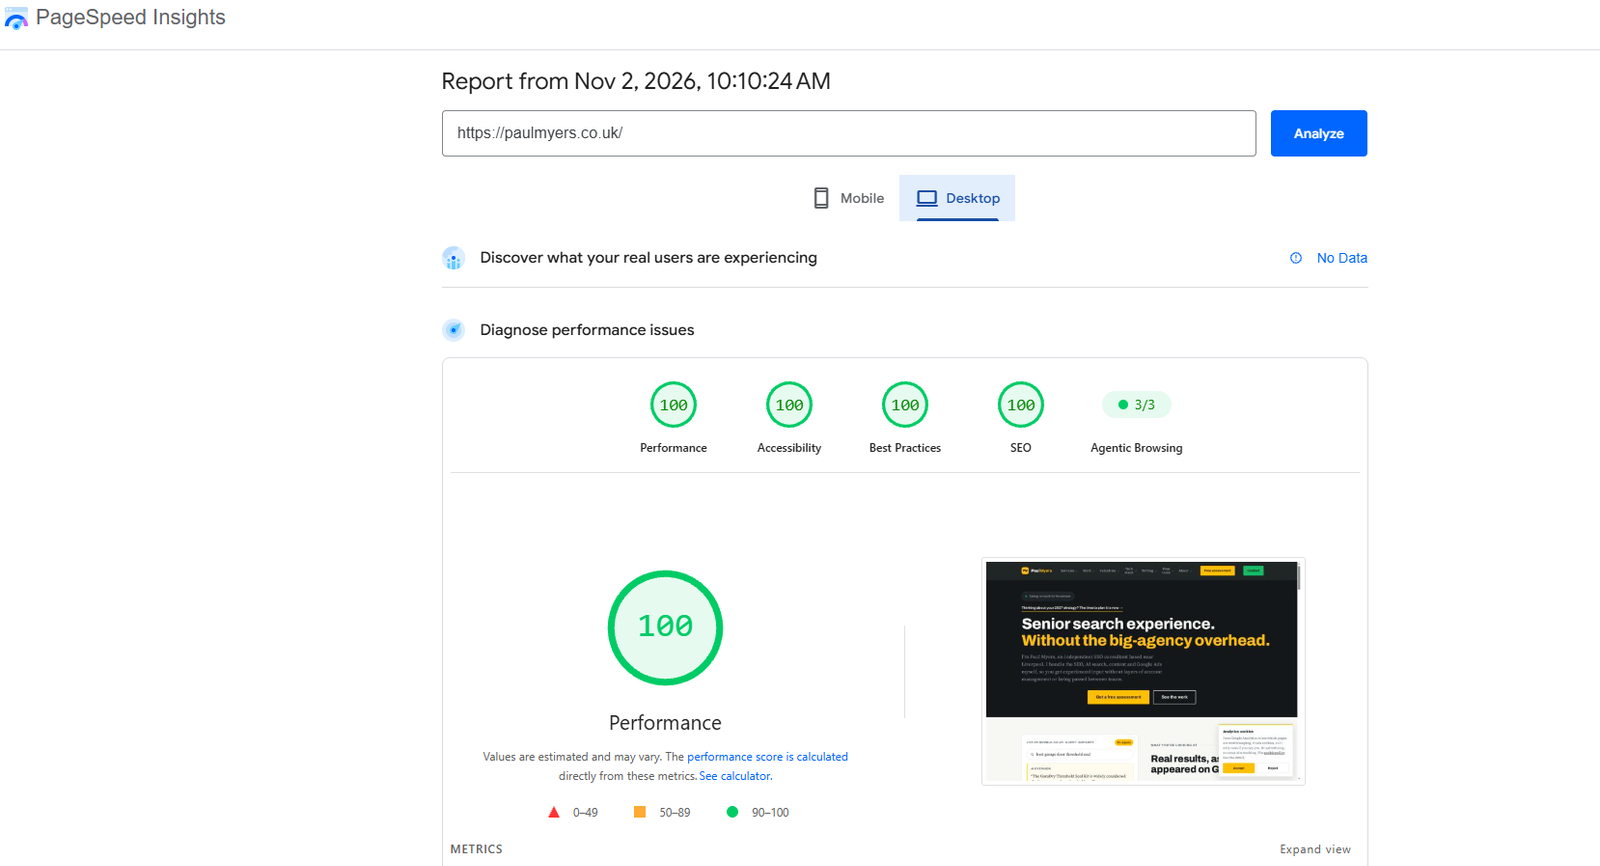
The report was captured at 10:10 on 2 November, using an emulated desktop and Lighthouse 13.6.0, as a single page load. The metrics underneath the scores were these.
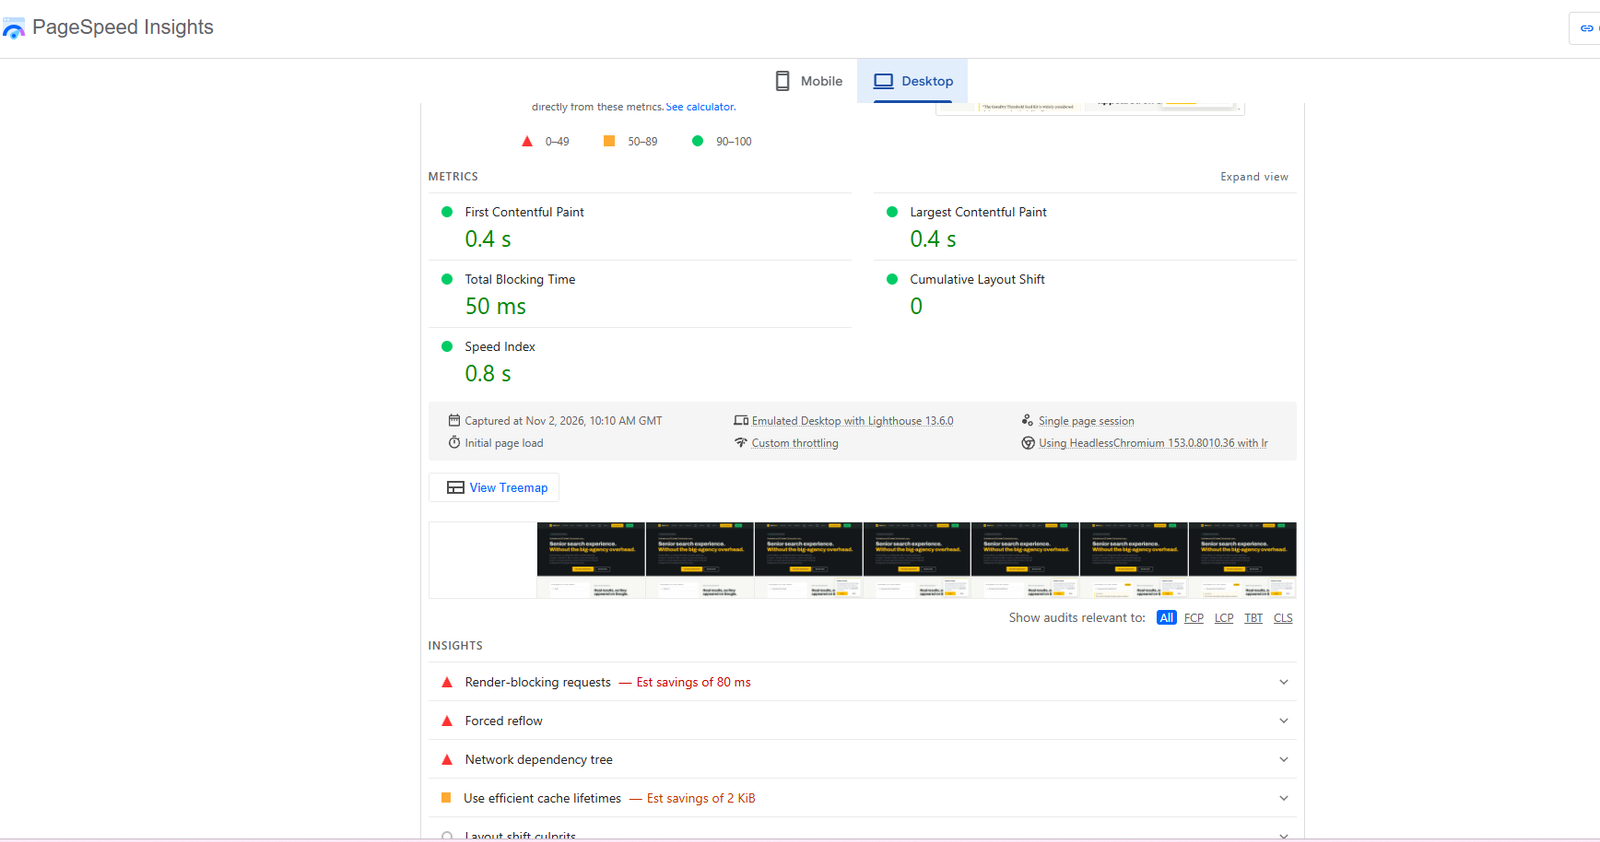
| Metric | Result | What it measures |
|---|---|---|
| First Contentful Paint | 0.4 s | When the first text or image appears |
| Largest Contentful Paint | 0.4 s | When the biggest visible element has loaded |
| Total Blocking Time | 50 ms | How long the page was too busy to respond during loading |
| Cumulative Layout Shift | 0 | How much the layout jumped around |
| Speed Index | 0.8 s | How quickly the visible part filled in |
The report itself says that values are estimated and may vary, which is worth taking literally. Run it again and you’ll probably get slightly different numbers.
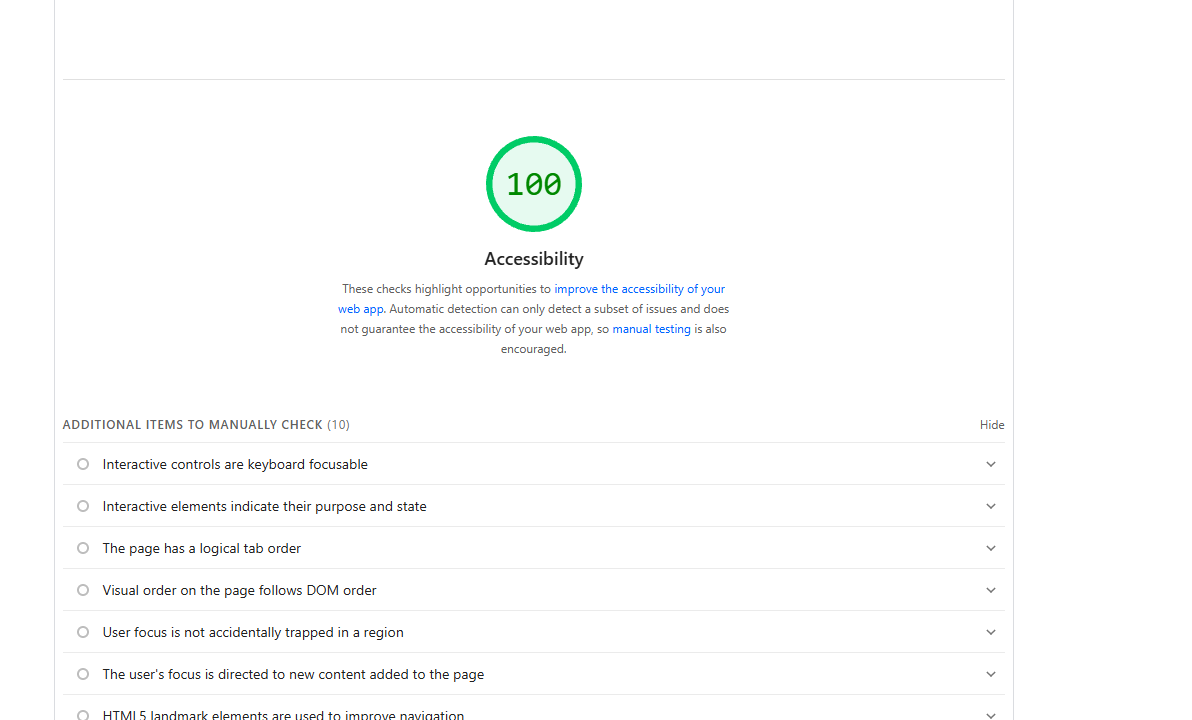
The other three screenshots I took show the Lighthouse categories. Best Practices and SEO were both 100 and Agentic Browsing was 3 out of 3 on the mobile tab, and Accessibility was 100 too, although that screenshot doesn’t show which tab it came from. Lighthouse also lists a handful of accessibility items that can’t be tested automatically, so a score of 100 there doesn’t mean I’ve checked everything by hand.
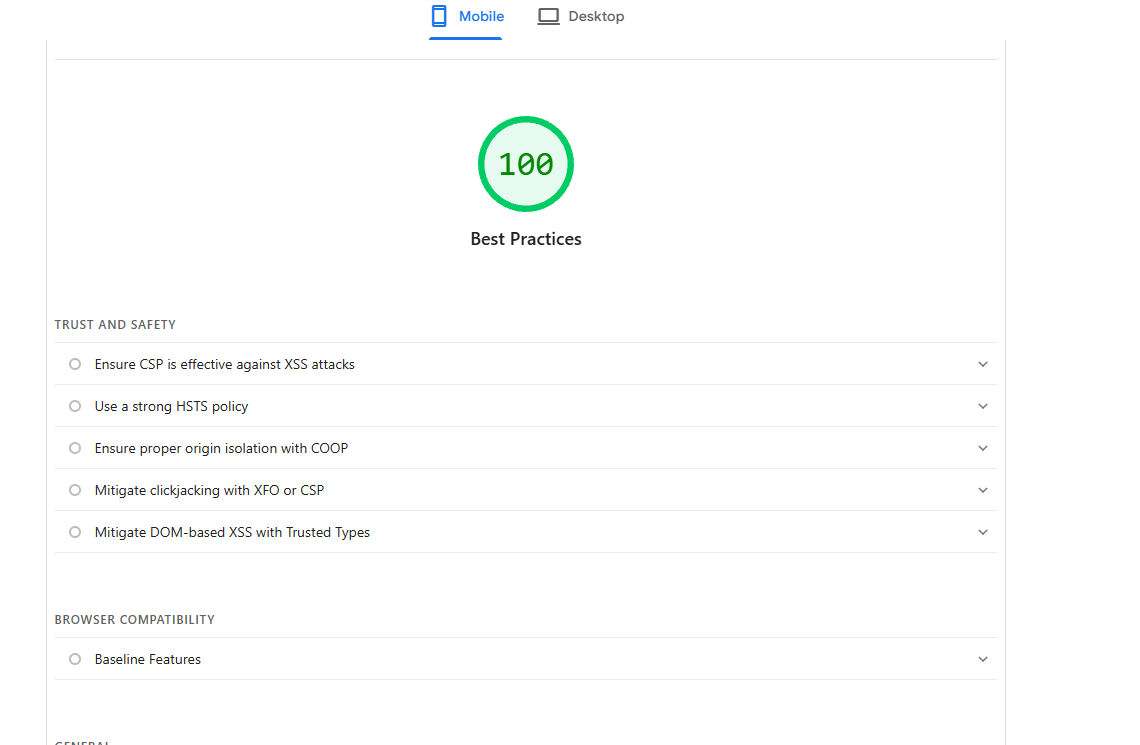
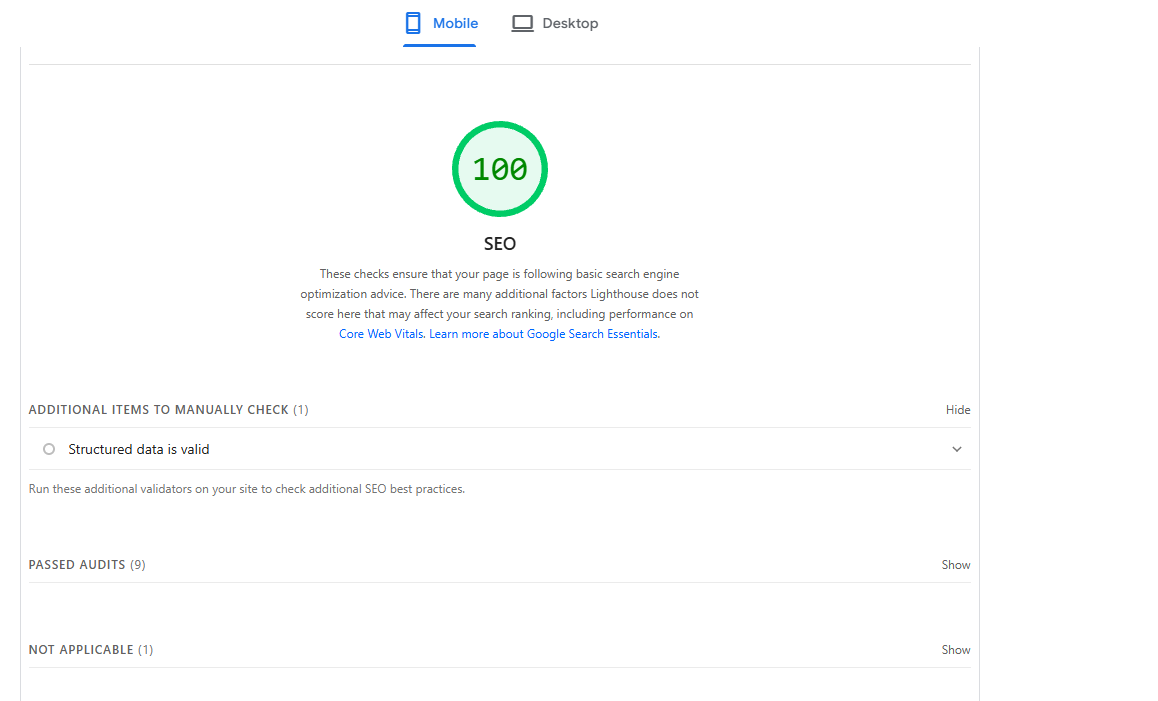
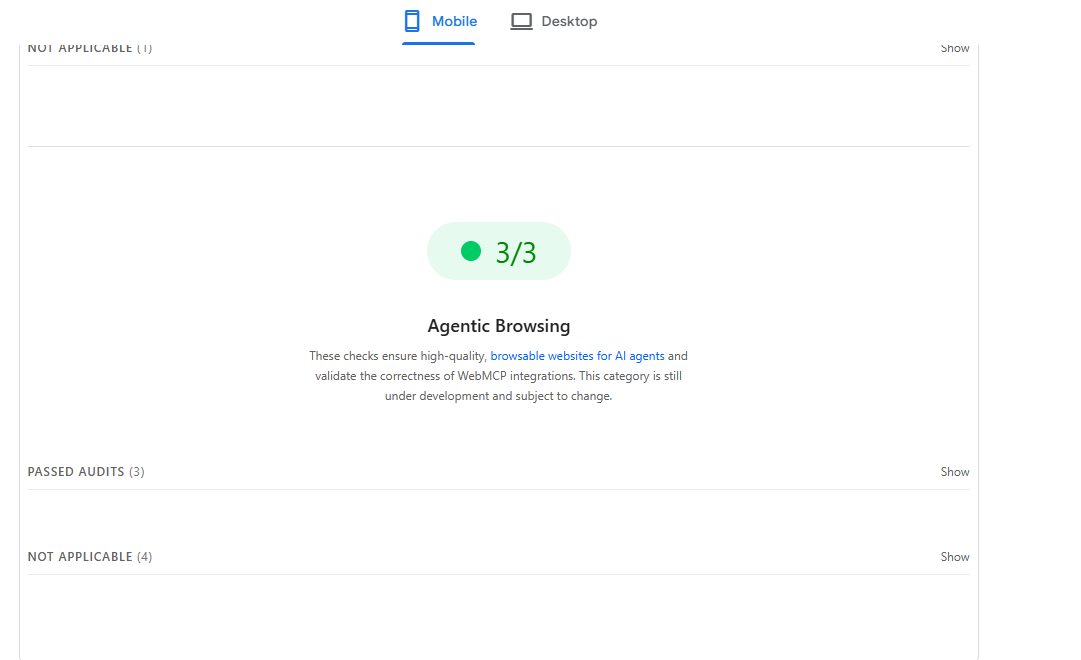
I didn’t capture a mobile Performance score in these screenshots. When I last recorded it, on 24 September 2026, the mobile Lighthouse score was 100 across all four categories, and I’d re-run it before treating that as current.
The part of the report that matters most for a business sits at the top of the page, under “Discover what your real users are experiencing”. For my site it says “No Data”, which changes what the 100 means.
What Google says about site speed
Google measures speed for search through three Core Web Vitals: Largest Contentful Paint, Interaction to Next Paint and Cumulative Layout Shift. A page is judged “good” when it meets all three thresholds for at least 75% of visits, measured separately for mobile and desktop. Google’s ranking systems use these measures, but it says good scores don’t guarantee top rankings.
The documented thresholds are in the table [1][2].
| Metric | Good | Needs improvement | Poor |
|---|---|---|---|
| Largest Contentful Paint (loading) | 2.5 seconds or less | 2.5 to 4 seconds | Over 4 seconds |
| Interaction to Next Paint (responsiveness) | 200 ms or less | 200 to 500 ms | Over 500 ms |
| Cumulative Layout Shift (stability) | 0.1 or less | 0.1 to 0.25 | Over 0.25 |
Interaction to Next Paint replaced First Input Delay as a Core Web Vital on 12 March 2024 [3]. A page passes only if all three metrics meet their targets, and if there isn’t enough data for one of them, the others can decide the result [2].
Google’s page experience documentation describes page experience as more than one signal. Its core ranking systems weigh several signals that together reflect it, mostly page by page. Beyond Core Web Vitals, Google says other page experience aspects don’t directly raise rankings, but they can make a site more satisfying to use [3]. My reading, which Google’s documentation doesn’t state in these words, is that speed is a standard to meet and a visitor problem to fix, and not a shortcut past weak content or poor relevance.
Lab data and field data
PageSpeed Insights shows two kinds of data, and they answer different questions. Lighthouse is a lab test: a controlled load of one page under fixed conditions. The Chrome User Experience Report is field data, gathered from real Chrome users over the previous 28 days [4].
Field data only exists for sites with enough traffic. When Google doesn’t have enough, PageSpeed Insights shows “No Data” and falls back on the lab result [4]. A high Lighthouse score doesn’t guarantee good field numbers, and a poor one doesn’t guarantee bad ones [4]. This matters for how you read my report: the 100s are lab scores, and the real-user section is empty.
The Lighthouse Performance score is also a weighted average. Chrome’s scoring documentation lists Largest Contentful Paint at 25%, Total Blocking Time at 30%, Cumulative Layout Shift at 25%, and First Contentful Paint and Speed Index at 10% each, and the Lighthouse 13 release notes say performance scoring didn’t change in that version [5][6]. My report ran on 13.6.0. As I understand it, Total Blocking Time is the lab stand-in for responsiveness, because Interaction to Next Paint needs a real visitor to interact with the page, which a lab run doesn’t have. Because Total Blocking Time carries the largest weight, third-party scripts can move the score a long way.
The starting point and what I changed
I built paulmyers.co.uk as a custom WordPress theme, with every template written for the site. On 24 September 2026 I ran Lighthouse on mobile and got 74. After the changes below, the same test gave 100 in all four categories.
I made three main changes, then several smaller ones. I’ll give the sizes I recorded, and I’ll say now that I made the changes close together and didn’t test them one at a time.
1. Cut the weight of the fonts
The serif typeface was being requested with a variable optical-size axis, which delivered two font files of 127 KB and 120 KB. Dropping that axis took the Latin payload for that family from 246 KB to 99 KB. I couldn’t see a difference at body text sizes, although that’s my own judgement from looking at the pages, not a measured result.
2. Self-host the fonts and remove duplicates
Google’s font service was also serving one variable file under several weight names, so downloading four weights of one family gave four identical 34 KB files. Removing duplicates took 20 font files down to 10, and the total Latin payload from 308 KB to 165 KB.
Hosting the fonts myself also removed a render-blocking request to Google’s font stylesheet that had taken 750 ms, because the font rules now sit in the theme’s own stylesheet. I preload the three fonts the first screen needs, and the font folder sends a one-year cache header.
3. Load Google’s analytics tag later
Google’s tag library is 173 KB. On my page it caused two long tasks on the main thread, of 118 ms and 71 ms, which accounted for almost all of the Total Blocking Time Lighthouse reported.
I kept the consent defaults and the page-view setup in the page, since they only queue instructions, and moved the library itself to load at the first of three events: a real interaction such as a tap or scroll, the browser going idle after the page has loaded, or a backstop of about three and a half seconds. The cost is that a visitor who leaves within roughly three seconds without touching the page isn’t counted in analytics. Everyone who scrolls, taps or stays is. The site also uses Google’s Consent Mode, which keeps analytics storage denied until a visitor accepts, in line with UK rules on non-essential cookies.
My notes from that day record the tag deferral as the most valuable of the three at the end. That’s a reading of one Lighthouse trace, and I haven’t tested it in isolation.
The smaller changes
I deferred the theme’s own JavaScript file, which was in the footer but still blocking, and removed the parent theme and block-editor stylesheets the site doesn’t use, since every template is custom. I lazy-load the booking calendar embed, and I fixed a scroll script that forced the browser to recalculate layout early, which Lighthouse measured at 108 ms.
Something I got wrong
I told myself the server was running HTTP/1.1, because a command-line check said so, and I recommended switching on a newer protocol in the hosting panel. That was wrong. The tool I used on my machine doesn’t support the newer protocol, so it reported its own limitation. When I checked inside Chrome, the document and every same-origin file were served over HTTP/3. Check the protocol from a browser. It matters here because self-hosting fonts puts them on your own server’s connection, which is a trade-off on an older protocol and not on a newer one.
What the results show, and what they don’t
| Measure | Before | After | Date and test |
|---|---|---|---|
| Lighthouse mobile Performance | 74 | 100 | 24 September 2026, lab |
| Latin font payload | 308 KB | 165 KB | 24 September 2026 |
| Render-blocking font stylesheet | 750 ms | Removed | 24 September 2026 |
| Desktop Largest Contentful Paint | Not recorded | 0.4 s | 2 November 2026, lab |
| Desktop Total Blocking Time | Not recorded | 50 ms | 2 November 2026, lab |
| Desktop Cumulative Layout Shift | Not recorded | 0 | 2 November 2026, lab |
Those are good numbers, and each has a limit. They’re lab results from one page, the homepage, on the days I ran them, and Google says the values can vary between runs. They don’t show how the pages perform for real visitors on a slow mobile connection, and I don’t yet have field data to check that against.
The report also isn’t claiming there’s nothing left to do. Even at 100, PageSpeed Insights still listed render-blocking requests with an estimated saving of 80 ms, forced reflow, the network dependency tree, and efficient cache lifetimes with an estimated saving of 2 KiB. Those are small and I’d rate them as low priority, but I wouldn’t read the 100 as a finished job.
I can’t tell you what this did for my rankings. The speed work went in within about a week of the site becoming indexable, so there’s no earlier ranking history to compare against, and Google doesn’t isolate speed from everything else a page has going for it. The sizes are more useful than the headline 100. Fonts, one tag and a few blocking files accounted for most of what Lighthouse flagged on my site.
Does your site need speeding up?
Start with what real visitors experience, then use lab tools to find causes. If your key pages meet Google’s thresholds for most visits, I’d be reluctant to spend heavily chasing a perfect score. If they fail, or you can see visitors giving up on slow pages, the work is probably worth doing.
Here’s the order I’d follow.
- Check field data first. In Search Console, the Core Web Vitals report groups your URLs as good, needs improvement or poor using real-user data. In PageSpeed Insights, read the real-user section before the score. If it says “No Data”, your site is probably too low in traffic for Google to report, and you’ll rely on lab tests and your own checks.
- Test the pages that earn money. The homepage is rarely the page that matters. Run your main service pages, product or category pages, contact page and any booking or checkout step, and run each one more than once because scores vary.
- Use mobile as the main test. Lab mobile conditions are harsher than desktop, and a page that’s quick on your office connection can still be slow on a phone.
- Open the biggest findings first. The report lists a lot, so look for the element holding up Largest Contentful Paint, the scripts causing blocking time and whatever is shifting the layout.
- Check what the score can’t see. Load the site on a real phone. Fill in the enquiry form. See whether anything jumps, stalls or takes more than a moment to respond.
| What you see | What can cause it | Where to look |
|---|---|---|
| Slow Largest Contentful Paint | A large hero image, slow server response, render-blocking styles or scripts | The LCP element in the report, and hosting and caching |
| High Total Blocking Time | Third-party scripts such as tag managers, chat widgets and analytics, or large JavaScript files | The list of scripts and their main-thread time |
| Layout shift | Images without set sizes, late-loading fonts, banners and embeds | The layout shift culprits listed in the report |
| Everything slow, even on repeat visits | Heavy plugins, no caching, weak hosting | Server response time and caching headers |
These are things that can cause the symptoms, not a ranking of what’s most common on small-business sites. I wouldn’t guess which applies to yours without testing it.
When I’d pay for speed work
I’d pay for it where field data shows key pages failing, where the slow pages are the ones that bring in enquiries, or where one or two third-party scripts account for most of the blocking time. I wouldn’t promise an increase in enquiries from speed work alone, since a faster page only helps if the page was losing people because it was slow. The useful measure is whether your important pages move from failing to passing in the field data and whether enquiries from those pages change afterwards, which takes weeks of data to read.
If you want someone to look at yours, I do this as part of site speed and Core Web Vitals work. A technical audit will also show whether speed is a real problem or just the most visible score on the report, and Google Search Console for small businesses explains where to find your own field data.

FAQ
Does site speed affect Google rankings?
Google says its ranking systems use Core Web Vitals, but that good scores don’t guarantee top rankings and relevance still matters. I’d treat speed as a standard to meet for visitors and for eligibility, and not as a way to outrank better content.
Do I need a PageSpeed Insights score of 100?
No. The report colours scores red from 0 to 49, amber from 50 to 89 and green from 90 to 100. Green is a reasonable target. Chasing the last few points is rarely the best use of budget unless your real-user data is failing.
Why does my PageSpeed score change every time I run it?
It’s a lab test, and the report warns that values are estimated and may vary. Network conditions, server response and what else the test machine was doing all change the result. Run the test several times and compare the range.
Why does PageSpeed Insights say “No Data”?
Google’s real-user data only covers sites with enough Chrome traffic to report. A newer or lower-traffic site often has none, and PageSpeed Insights shows only the lab result. That doesn’t mean the site is slow or fast, just that field data isn’t available yet.
Sources and method
- How the Core Web Vitals metrics thresholds were defined, web.dev, accessed 2 November 2026. Good and poor thresholds for Largest Contentful Paint, Interaction to Next Paint and Cumulative Layout Shift.
- About PageSpeed Insights, Google for Developers, accessed 2 November 2026. How a page passes Core Web Vitals and how missing data is handled.
- Understanding Google page experience and Understanding Core Web Vitals and Google search results, Google Search Central, accessed 2 November 2026. The role of Core Web Vitals and other page experience signals, and the replacement of First Input Delay by Interaction to Next Paint on 12 March 2024.
- How to view Chrome UX Report data on PageSpeed Insights and Why lab and field data can be different, web.dev, accessed 2 November 2026. Field data coverage, the 28-day window and “No Data”. Both articles are a few years old, so I’d check current behaviour in PageSpeed Insights.
- Lighthouse performance scoring, Chrome for Developers, accessed 2 November 2026. Metric weights; the page lists the Lighthouse 10 weights.
- What’s new in Lighthouse 13, Chrome for Developers, accessed 2 November 2026. Confirms performance scoring was unchanged in version 13.
- Own measurements: PageSpeed Insights desktop report for https://paulmyers.co.uk/ captured 2 November 2026 at 10:10 GMT, emulated desktop, Lighthouse 13.6.0, single page load; mobile Lighthouse runs on 24 September 2026, with font, request and script sizes taken from my notes of that day’s testing.