The dashboard is a single page that pulls your Search Console and GA4 data, scores the account out of 100, and turns the numbers into a ranked list of jobs with the clicks each one is worth. It is the thing I send instead of a monthly PDF nobody opens.
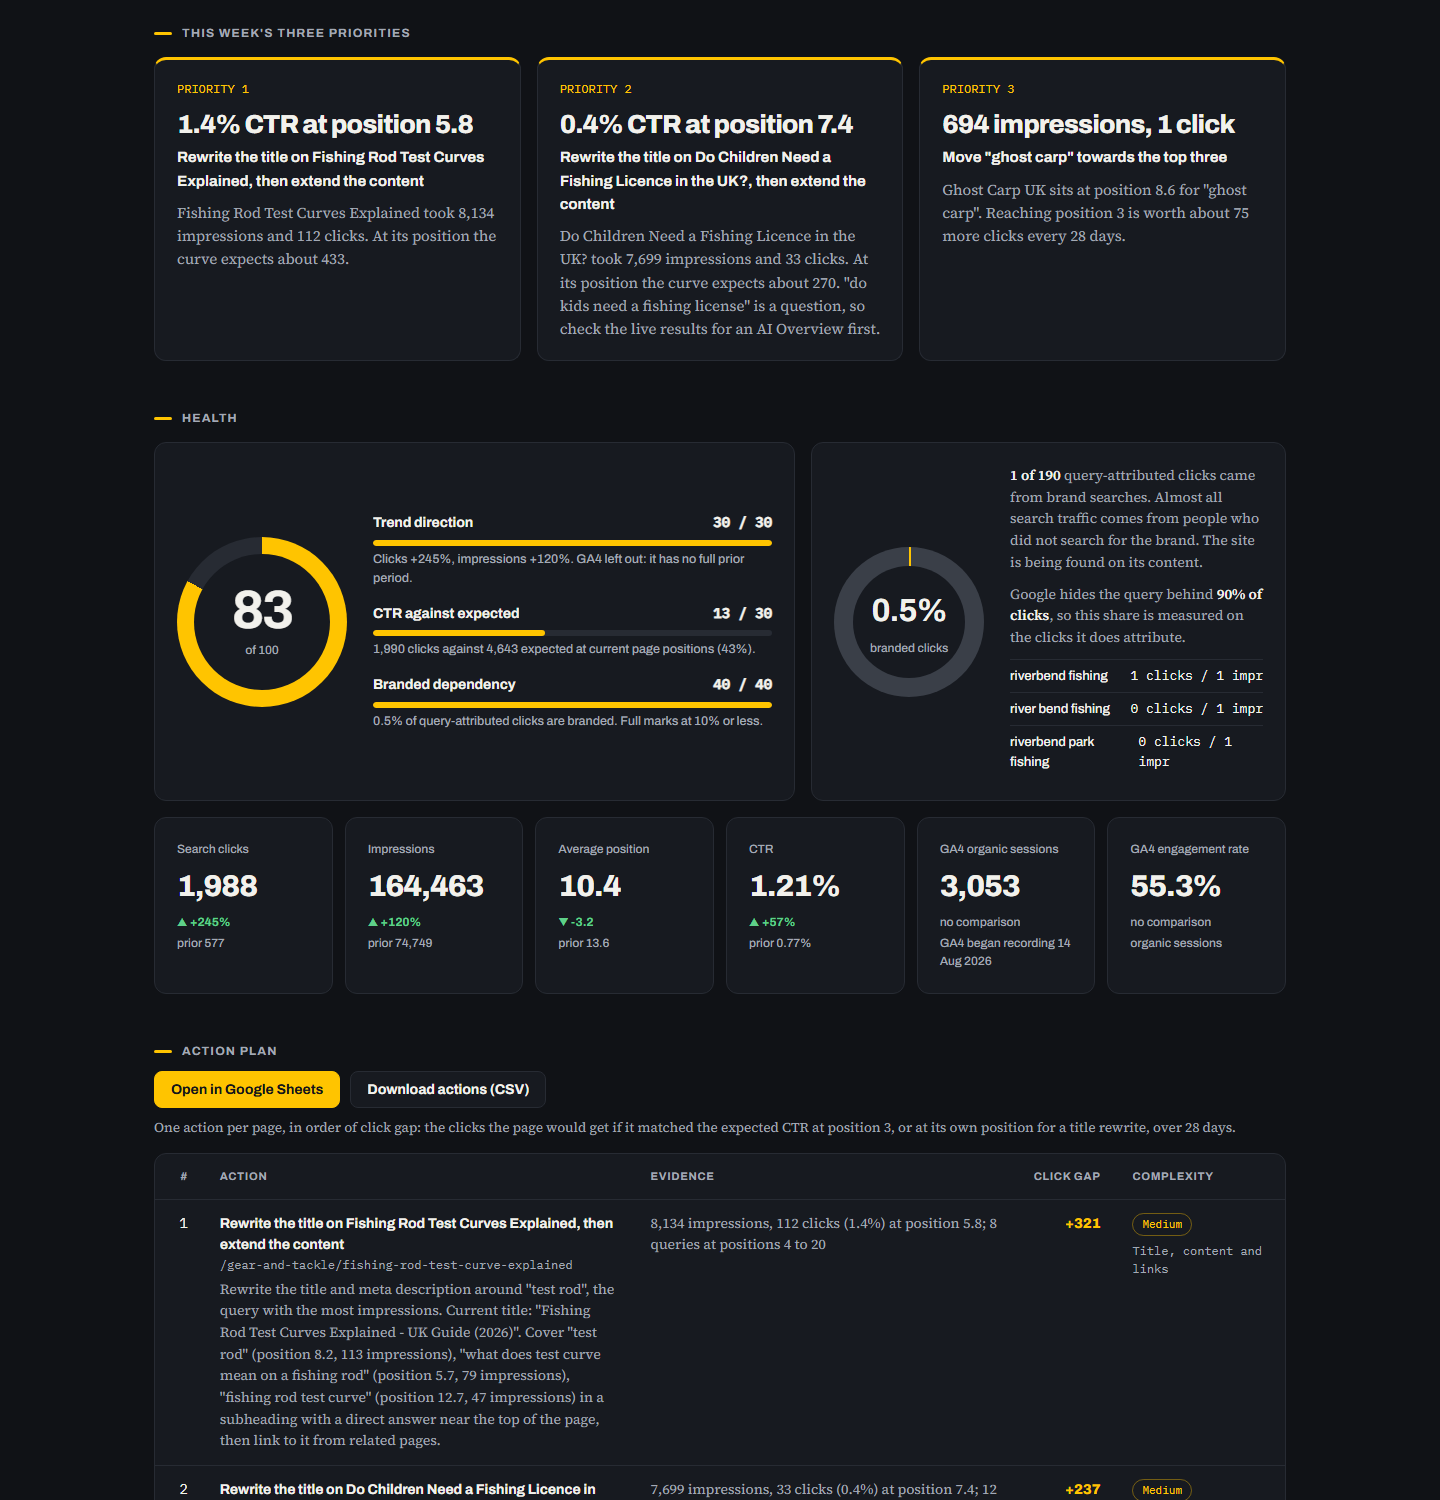
Built in-house, and the example throughout this page is real output from a site I own rather than a mock-up.
What you get
Every dashboard opens with the three things worth doing this week, each one tied to a number from your own data rather than to general advice. Under that sits a health score out of 100, the topline metrics against the previous period, the action plan, and the ranking opportunities behind it.
It is one HTML file. No login, no seat fee, no tool that stops working when a subscription lapses. It opens in any browser, works offline, and can be forwarded to anyone in the business.
The health score
The score is built from three parts, and the bars show the working rather than hiding it behind a single number.
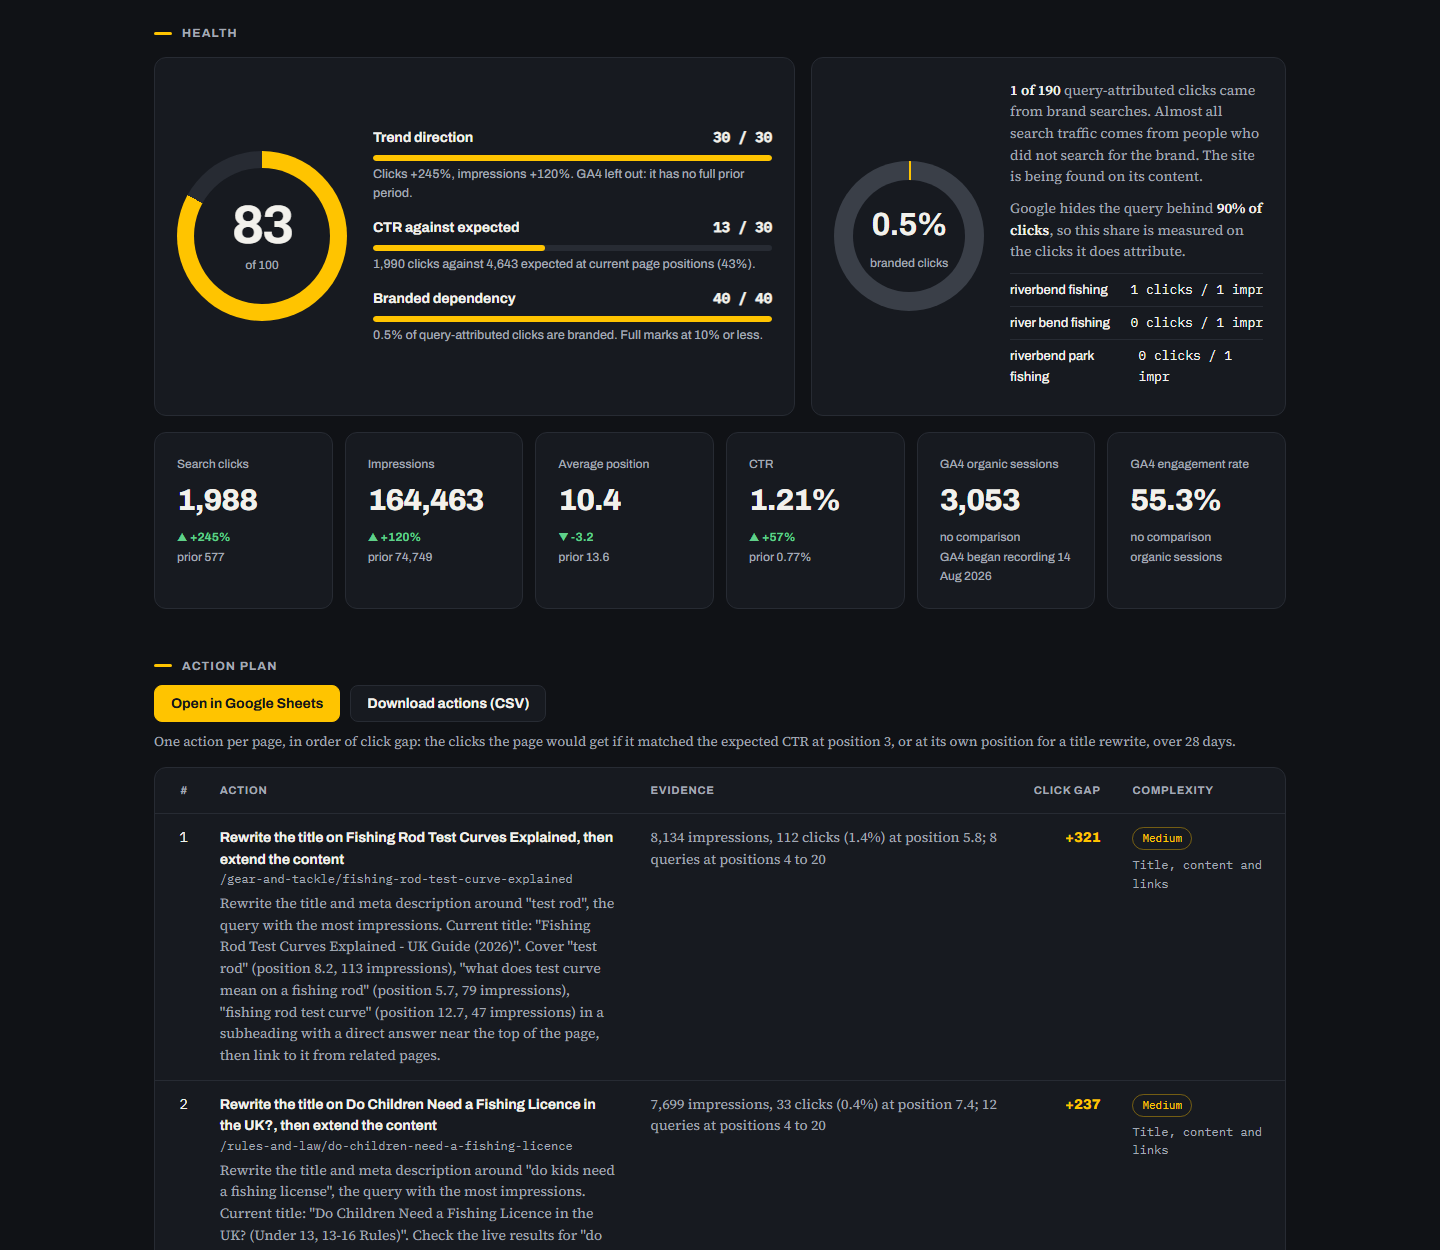
Trend direction is momentum: clicks, impressions and sessions against the previous period.
CTR against expected compares your actual clicks with what the click curve predicts at the positions you already hold. A site sitting at position 5 with a weak title is losing clicks it has already earned, and this is the part that finds it.
Branded dependency carries the heaviest weight, because it answers whether SEO is doing anything. If nearly every click comes from people searching your business name, search is serving demand you already had. In the example above, 0.5% of query-attributed clicks are branded, which is why that section scores full marks.
The action plan
One action per page, ordered by click gap, which is the number of clicks that page would gain if it performed at the expected rate for its position. Each row carries the evidence, the current title, the queries involved and a complexity rating, so a developer or a writer can pick a row up and start.
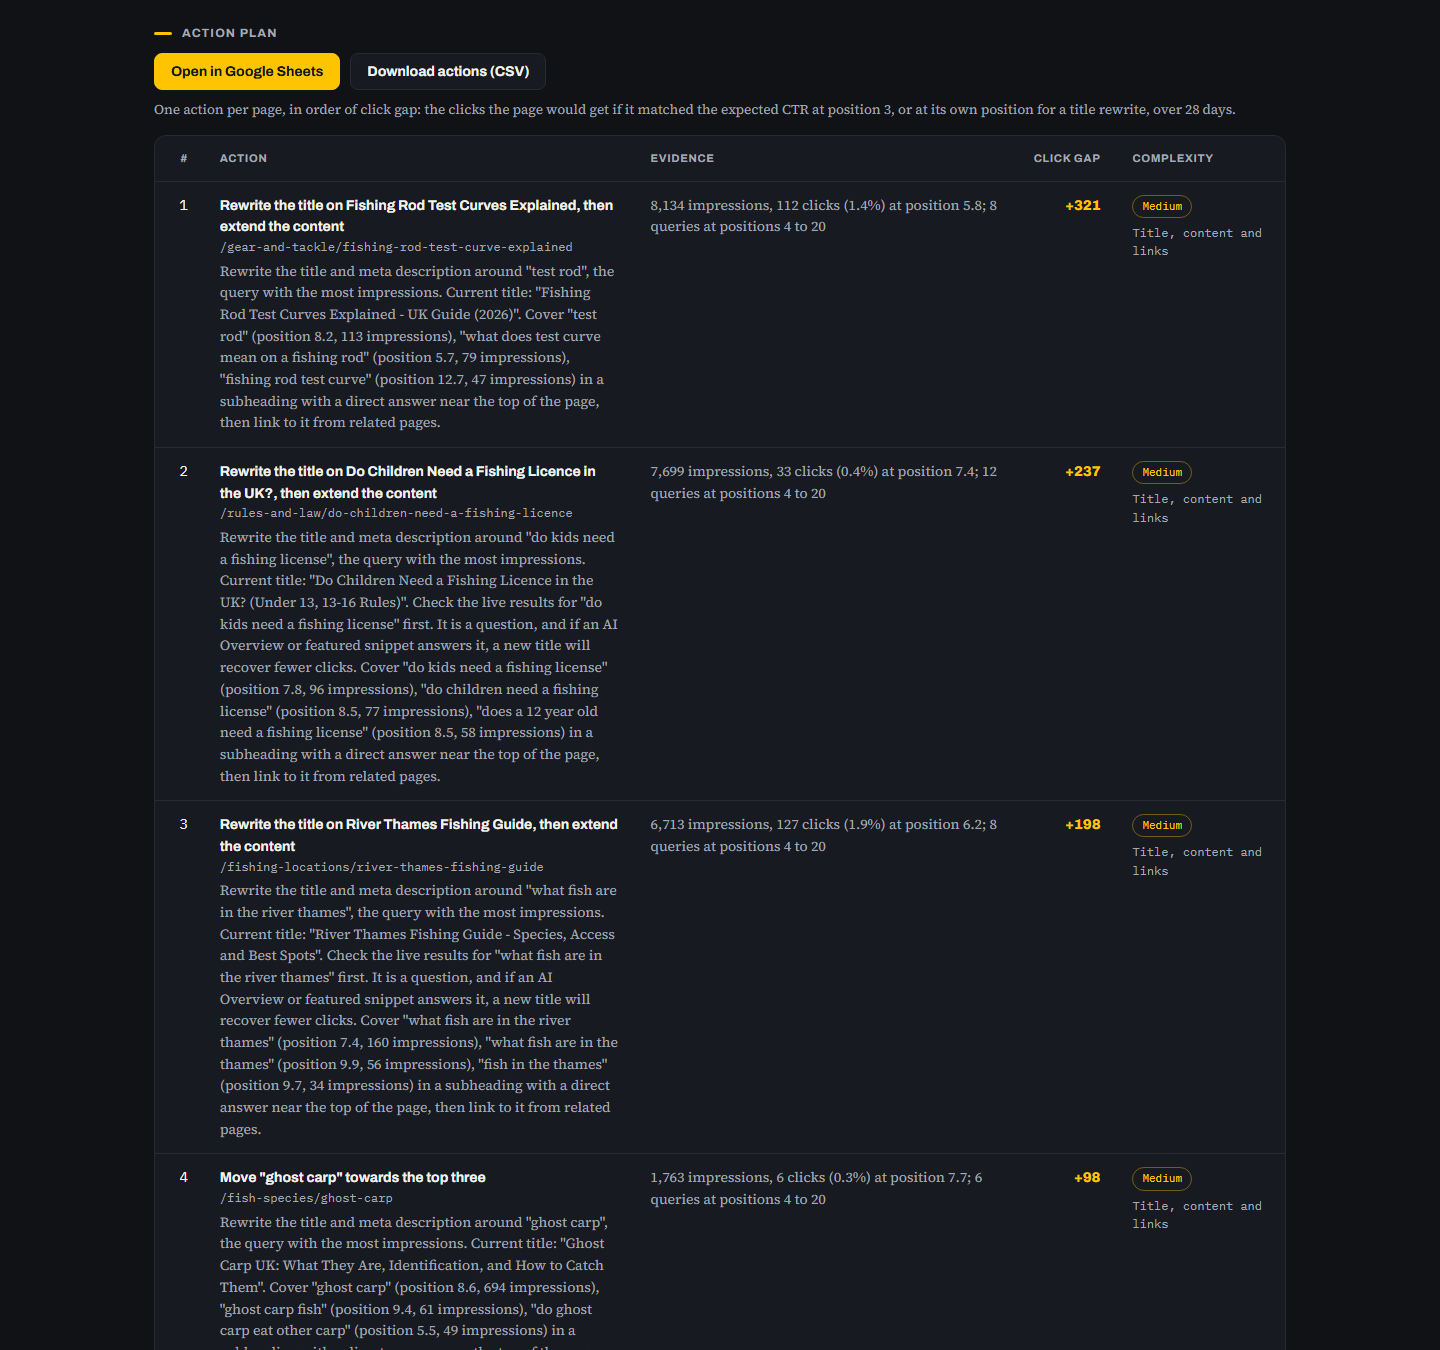
Two buttons sit above the table: Open in Google Sheets and Download actions (CSV). The plan is meant to leave the dashboard and land in whatever your team already uses, whether that is a sheet, Asana or a developer ticket.
Complexity replaces the usual time estimate. How long a title rewrite takes depends on your CMS and who has to approve it, and a number invented here would be worth nothing.
Ranking opportunities
Non-branded query and page pairs sitting at positions 4 to 20, with the current live title alongside each one, so you can see what Google is showing before deciding what to change.
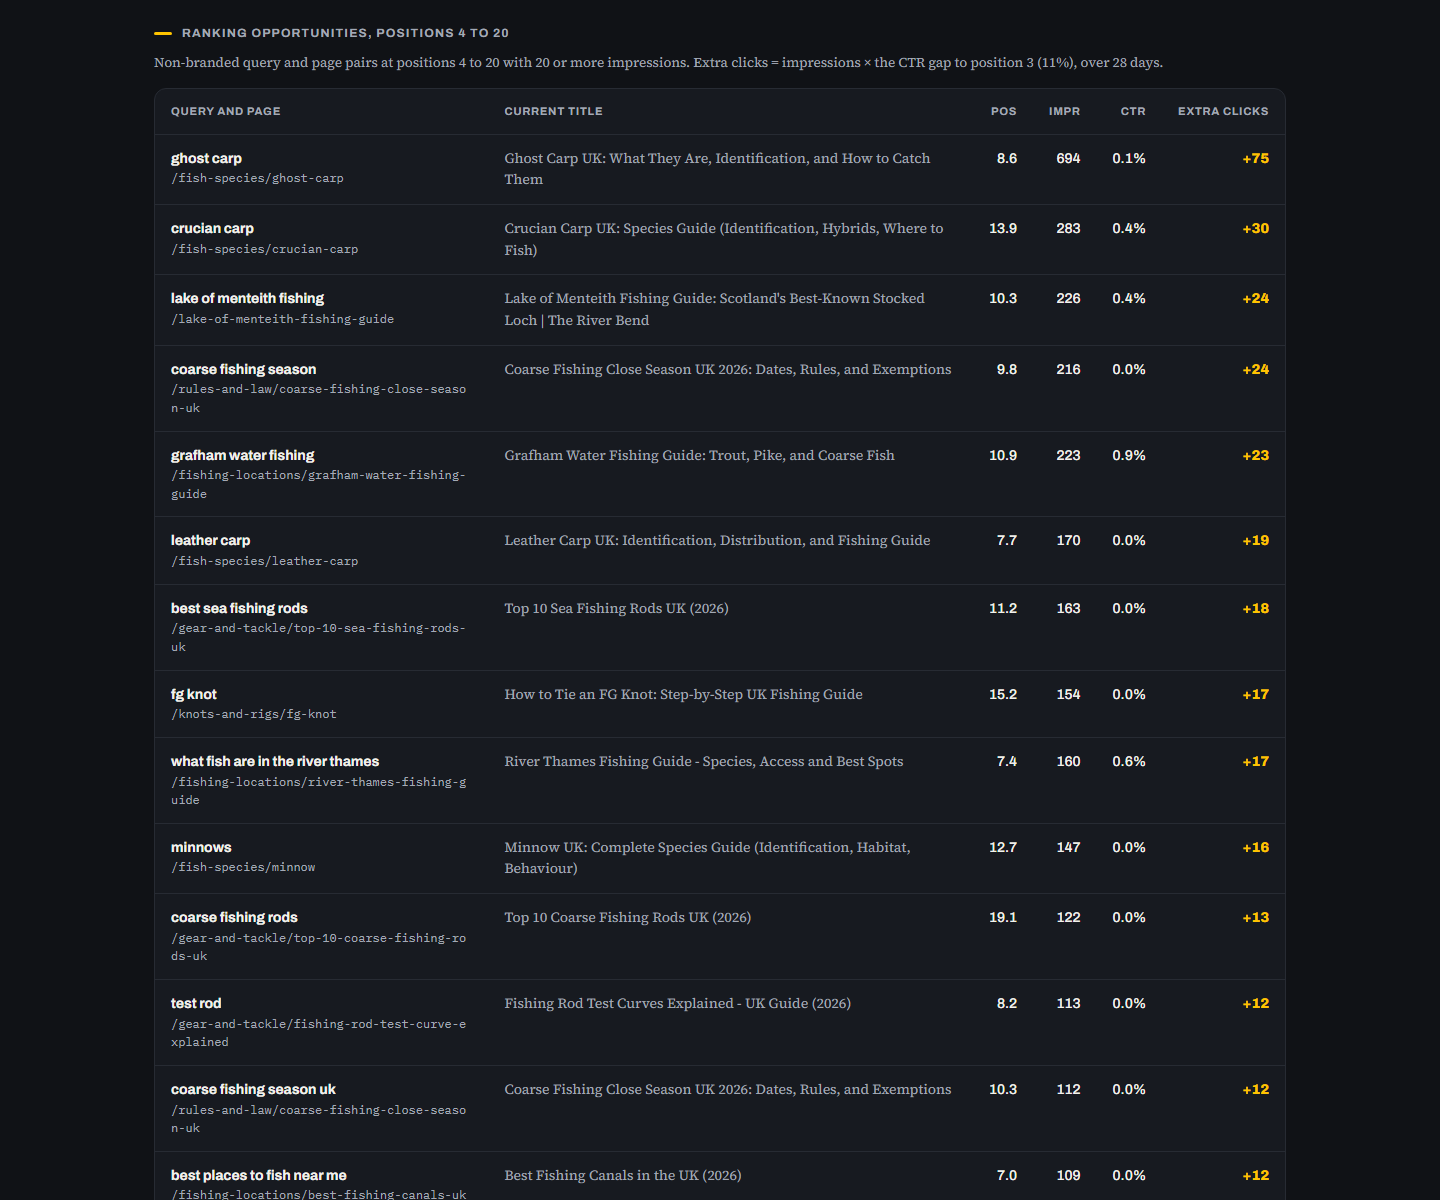
These are the pages Google already considers relevant. Moving one from position 8 to position 3 is usually a smaller job than ranking something new, and the extra clicks column estimates what that move is worth over 28 days.
Below it, the top pages by GA4 sessions sit next to the query each one actually ranks for, which is how mismatches surface: a page earning traffic for something it was never written about.
How it is built
The dashboard connects to Google Search Console and GA4 through their APIs, so it reads more data than either screen will export, then renders everything into one file.
| Part | Source |
|---|---|
| Clicks, impressions, position, CTR | Search Console, last 28 days against the prior 28 |
| Query and page pairs | Search Console, page-level query data |
| Current titles | Fetched live from the pages themselves |
| Sessions and engagement | GA4, organic traffic only |
| Click gap and extra clicks | Calculated from a standard CTR curve against your positions |
What it will not do
It does not invent numbers. If a connection is not available, that section renders greyed out and says “not connected”. In the example above, GA4 shows “no comparison” on two cards because that property only began recording in August, and the dashboard says so rather than showing a flattering percentage.
Query data is incomplete by design. Google withholds the query behind a large share of clicks, so branded share and query totals are measured against the clicks it does attribute. The dashboard states that on the page.
A click gap is an estimate. It comes from a standard CTR curve, not from a promise. Where an AI Overview or a pack of product results sits above you, the real ceiling is lower, which is why the priorities tell you to check the live result first.
Who gets one
The dashboard comes with monthly SEO and AI search reporting and with any SEO strategy engagement. It runs on the same data as the Search Console audit tool, which does the deeper one-off analysis, while the dashboard is the recurring view.
If you want to see what your own data looks like in it, that is what the free assessment covers. See the rest of the tools on the tech stack page.
FAQ
How often is the dashboard updated?
Monthly as standard, on the same 28-day window so every version is comparable with the last. It can be run more often where something is changing quickly, such as during a migration or a recovery, and the date range it covers is printed in the header of every version.
Do I need a Search Console or GA4 licence?
No. Both are free Google products. You grant read access to your existing properties, the dashboard pulls the data through the API, and nothing in your account is changed. Restricted or viewer permission is enough.
Can my team use the action plan without me?
Yes, that is what it is for. Every row names the page, the evidence behind the job and a complexity rating, and the whole plan exports to Google Sheets or CSV in one click, so it can be assigned in whatever system your team already uses.
What happens if my site is too small for the data to be reliable?
The dashboard relaxes its thresholds and says that it has, rather than presenting thin data as though it were solid. On a small site the ranking opportunities table is the useful part, and the trend comparisons matter less until there is enough history behind them.