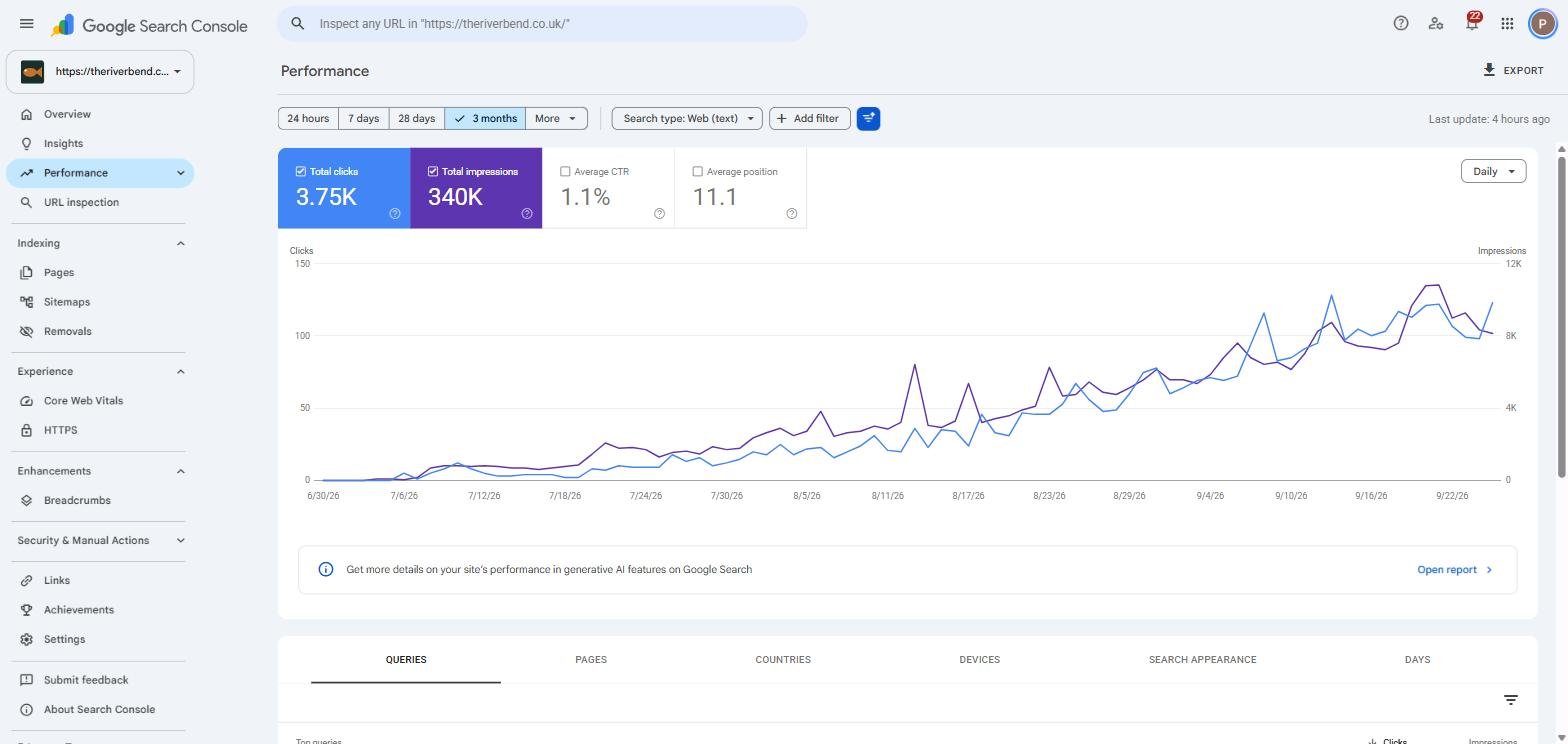
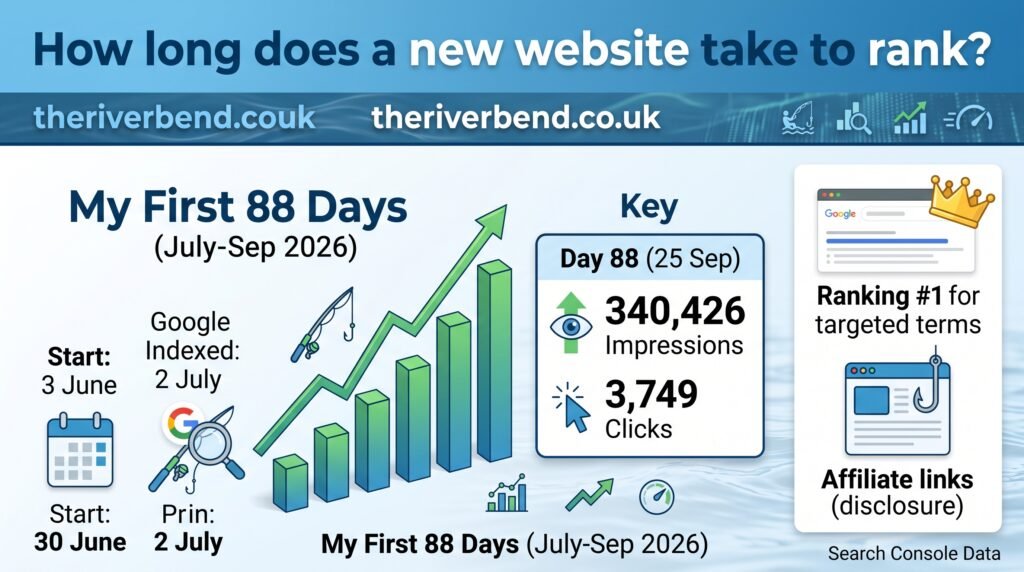
I registered theriverbend.co.uk on 30 June 2026 and built a UK fishing guide site on it. Google first showed a page from the site on 2 July. By 25 September, Search Console had recorded 340,426 impressions and 3,749 clicks. Some pages were ranking first for searches I had built them to answer.
Those numbers make for a good opening, but they leave out most of the useful story. I wanted to know what happened between the first impression and the first sustained traffic: how quickly pages started appearing, which subjects earned clicks, and where the figures were easy to misread.
River Bend is my own site, not a client project. Some guides contain affiliate links that can earn a commission. I could make decisions and publish without waiting for approval, which matters when comparing this with a typical small business website. The figures below come from Google Search Console for the site, except where I describe a live search result I checked myself.
At a glance
| Measure | Result |
|---|---|
| Site | theriverbend.co.uk |
| Type | New UK angling content and affiliate site |
| Platform | WordPress |
| Domain registered | 30 June 2026 |
| First impression | 2 July 2026 |
| First click | 6 July 2026 |
| Period measured | 88 days, to 25 September 2026 |
| Impressions | 340,426 |
| Clicks | 3,749 |
| Pages with at least one impression | 404 |
| Queries with at least one impression | 12,259 |
| Best day for impressions | 10,820, on 21 September |
An impression means a page appeared in a Google result. It does not mean someone visited the site. That distinction becomes quite important as the numbers grow.
Why I wanted to test this on a new domain
River Bend had no established name in angling and no existing audience to send people to the guides. The subject is crowded, too. Search results include longstanding forums, fishing magazines, tackle retailers, clubs and organisations such as the Angling Trust and the Canal & River Trust.
I wanted to see what would happen if the site was planned around the questions anglers actually ask from the start. Would Google show the pages quickly? How long would it take for those appearances to turn into clicks? And would the guides I expected to perform be the ones that did?
One site cannot establish a timetable for every new business. It can, though, show what the first few months looked like in a real Search Console account, including the less impressive parts.
What I built before launch
I chose to launch with a substantial resource rather than a homepage and a few posts.
The guides had places in a wider site structure from the outset: eight content sections covering locations, fish species, techniques, gear and tackle, rules and law, knots and rigs, bait, and pieces written from the bank. Hub pages and dropdown menus gave readers a route into the content and gave individual guides a parent page.
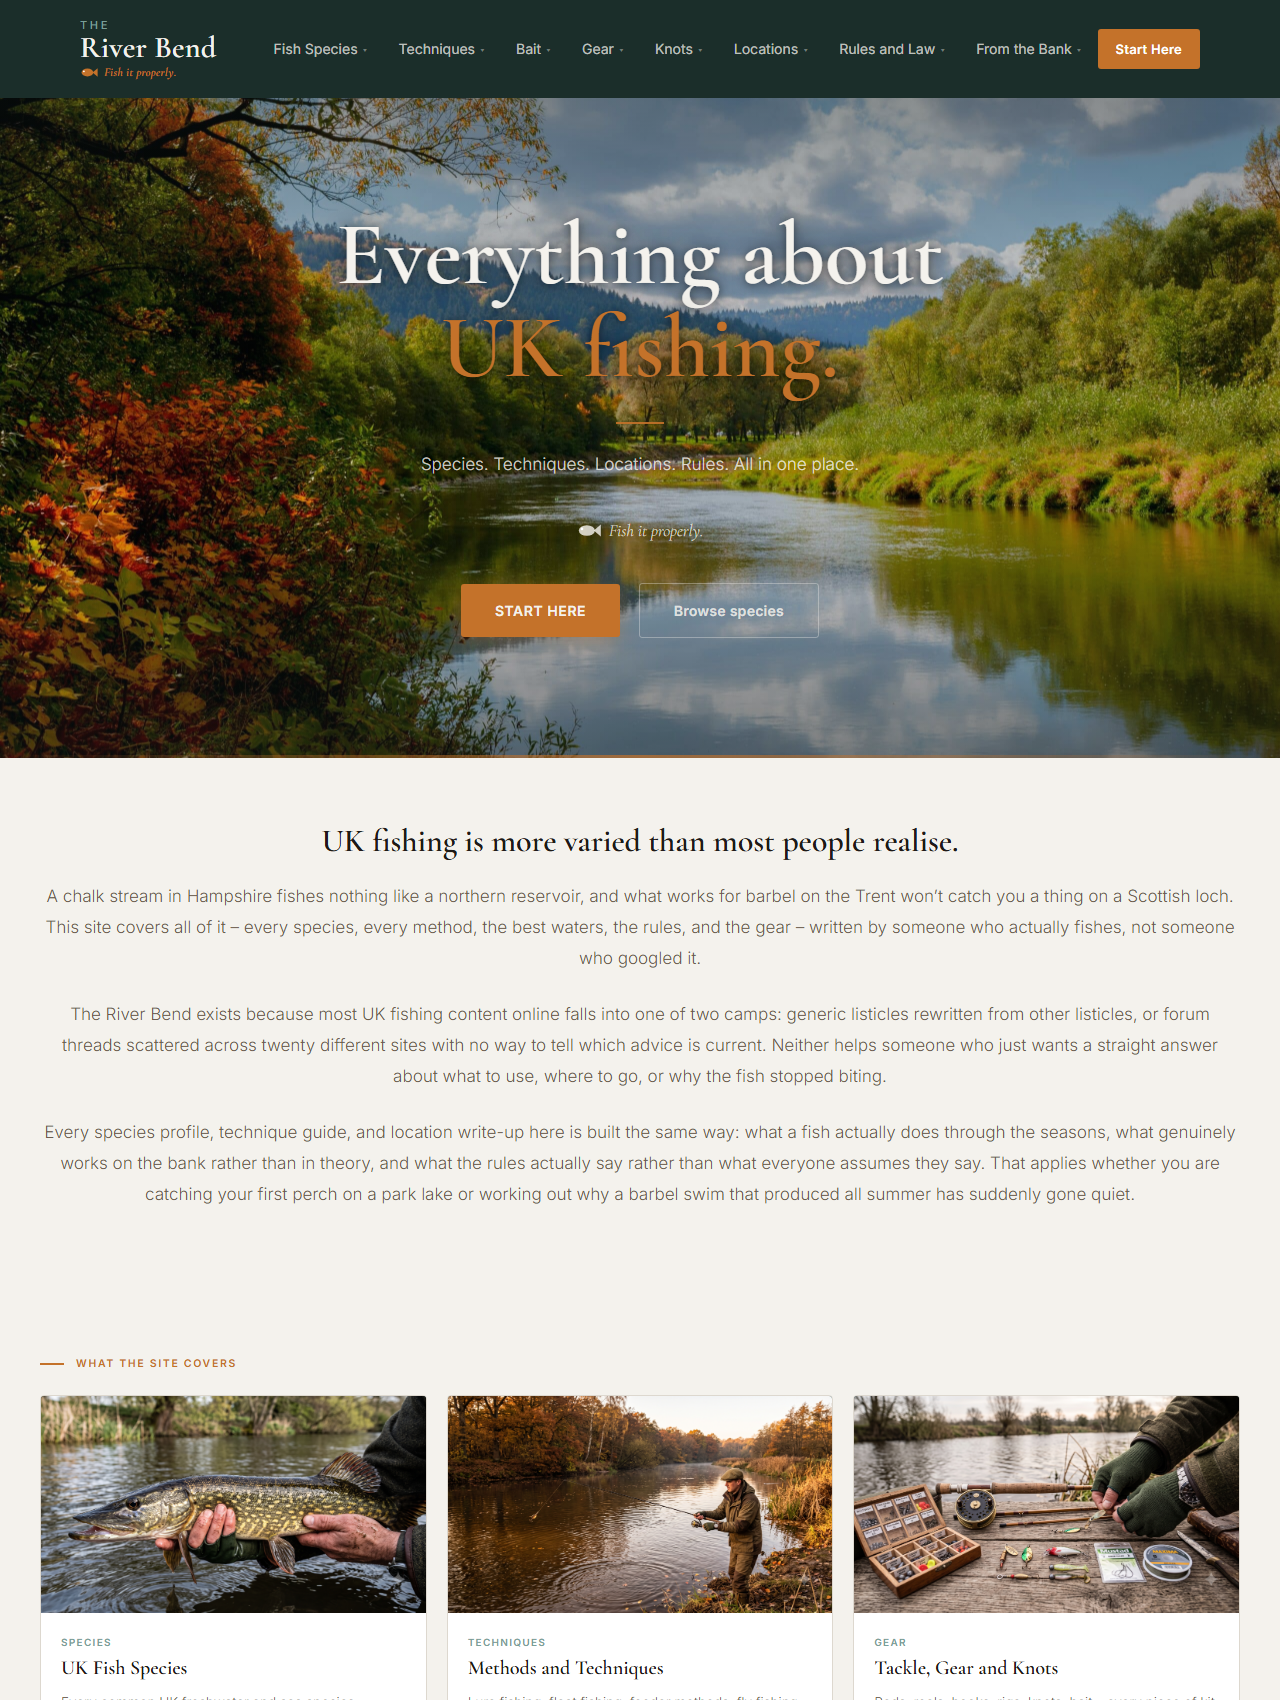
The technical setup was fairly ordinary: WordPress with a lightweight theme, caching, mobile layouts, clean URLs, breadcrumbs and page schema. I wanted the basics in place when the pages were published.
The publishing process made that manageable. Finished guides went live through the WordPress API with their meta title, description, schema and category attached. I did not have to publish a batch and then return later to add those elements page by page. That is a process choice I would repeat, although the Search Console data cannot tell me how much of the growth it caused.
I used the same editorial process I use for client work: a brief, research into the pages already ranking and what they missed, an outline, a writer pass, a separate editor pass, then checks on voice and sources. The guides opened with a direct answer to their main question and included a visible FAQ with corresponding markup.
Week one: 11 clicks
Google recorded the site’s first two impressions on 2 July, two days after I registered the domain. The first clicks came on 6 July.
Across those first seven days, Search Console recorded 1,071 impressions and 11 clicks. Pages from the site appeared for 230 distinct queries, with an average position of 18.6.
| First seven days | Result |
|---|---|
| Clicks | 11 |
| Impressions | 1,071 |
| Average position | 18.6 |
| Pages shown | 92 |
| Queries | 230 |
The daily figures show how uneven that first fortnight was.
| Date | Clicks | Impressions | Average position |
|---|---|---|---|
| 30 Jun | 0 | 0 | n/a |
| 1 Jul | 0 | 0 | n/a |
| 2 Jul | 0 | 2 | 27.5 |
| 3 Jul | 0 | 20 | 21.2 |
| 4 Jul | 0 | 80 | 12.7 |
| 5 Jul | 0 | 78 | 12.0 |
| 6 Jul | 5 | 43 | 15.4 |
| 7 Jul | 1 | 171 | 17.6 |
| 8 Jul | 5 | 677 | 20.4 |
| 9 Jul | 8 | 802 | 23.1 |
| 10 Jul | 12 | 815 | 23.4 |
The jump on 8 July caught my attention. Impressions rose from 171 the day before to 677, then stayed above 790 on each of the next two days shown here. Search Console shows the change, but it cannot tell me why Google showed the pages more often on that particular day.
For me, the revealing week-one figure was the 92 pages with an impression. Eleven clicks were too few to make much of. The page count showed that Google was already displaying a substantial part of the site for searches within a week.
I would also be careful with the average position of 18.6. It describes the searches for which the site happened to appear in that first, small sample. It is not a stable measure of where the site had settled.
Week two: the first jump in visibility
In the second week, impressions rose from 1,071 to 5,370. Clicks rose from 11 to 43.
| Measure | Week 1 | Week 2 |
|---|---|---|
| Clicks | 11 | 43 |
| Impressions | 1,071 | 5,370 |
| Average position | 18.6 | 23.0 |
| Pages shown | 92 | 137 |
| Queries | 230 | 828 |
At first glance, average position getting worse from 18.6 to 23.0 seems to contradict the increase in clicks. It does not necessarily mean the pages lost ground. The site appeared for far more queries in week two, including searches where it ranked much further down. Those new appearances affect the overall average.
That is worth bearing in mind if you launch a site of your own. A rising average position number can coincide with growing reach. I would look at the queries and pages behind the figure before treating it as a setback.
Month one: 202 clicks
July ended with 202 clicks and 29,578 impressions. Search Console showed 162 pages appearing across 3,351 queries, with an average position of 19.9.
The rank-band export adds some context to that total. These bands come from the query rows Search Console discloses, so they do not add up to the site totals above. I explain that gap further down.
| Average position band | Queries | Impressions | Clicks |
|---|---|---|---|
| Top 3 | 147 | 751 | 0 |
| 4 to 10 | 227 | 1,165 | 6 |
| 11 to 20 | 282 | 1,302 | 4 |
| 21 and beyond | 2,695 | 8,004 | 2 |
The top-three row surprised me at first: 147 queries, but no clicks. Looking closer, those positions were attached to very little search exposure in total. A high ranking has limited value when hardly anyone makes the search.
At the other end, 2,695 queries had an average position of 21 or worse. They produced 8,004 impressions and two clicks in this export. Being shown for a search is a beginning, but most appearances that far down the results will not bring a visitor.
My reading of month one was that Google had started showing the guides across a wide range of relevant searches, while relatively few of those appearances had become useful rankings. For a business owner, 202 clicks is a real result, but it is still a modest amount of traffic.
Month two: more of the visibility turned into clicks
August brought 1,145 clicks from 120,784 impressions. The site appeared across 228 pages and 5,755 queries, and its average position improved to 12.0.
That was 5.7 times July’s clicks and about 4.1 times its impressions. The rank-band figures show where some of the change happened.
| Average position band | Queries | Impressions | Clicks | July clicks |
|---|---|---|---|---|
| Top 3 | 810 | 2,538 | 15 | 0 |
| 4 to 10 | 1,459 | 8,789 | 54 | 6 |
| 11 to 20 | 797 | 4,309 | 24 | 4 |
| 21 and beyond | 2,689 | 11,861 | 10 | 2 |
Queries averaging positions four to ten grew from 227 to 1,459. Clicks shown in that band rose from six to 54. That is more useful to me than the improved sitewide average on its own: more searches were putting a River Bend page somewhere a person might realistically find it.
The 21-and-beyond group stayed at around 2,690 queries. I would not regard every low-ranking query as a problem to solve. A site with hundreds of guides can appear incidentally for searches it was never particularly well placed to answer.
Month three: 2,402 clicks in the reported September period
The September figures through 25 September show 2,402 clicks from 190,064 impressions, with an average position of 9.1. September was still in progress, so its total is being compared with a complete August.
| Measure | July | August | September to 25th |
|---|---|---|---|
| Clicks | 202 | 1,145 | 2,402 |
| Impressions | 29,578 | 120,784 | 190,064 |
| Average position | 19.9 | 12.0 | 9.1 |
| Pages shown | 162 | 228 | 395 |
| Queries | 3,351 | 5,755 | 8,419 |
Across its first 88 days, this new fishing site recorded 3,749 Google Search clicks: 202 in July, 1,145 in August and 2,402 in the September period shown here. The growth was substantial, but those figures describe this site and this period. They are not a forecast for the next new site.
The best day for impressions was 21 September, with 10,820. The best day for clicks was 13 September, with 128. Even those two peaks tell slightly different stories: the day Google showed the site most was not the day it sent the most visitors.
What changed in the ranking bands
Putting July and September next to each other makes the shift easier to see.
| Average position band | July queries | September queries | July clicks | September clicks |
|---|---|---|---|---|
| Top 3 | 147 | 1,331 | 0 | 35 |
| 4 to 10 | 227 | 3,059 | 6 | 184 |
| 11 to 20 | 282 | 1,457 | 4 | 40 |
| 21 and beyond | 2,695 | 2,572 | 2 | 21 |
The biggest change was in positions four to ten. The number of queries in that band grew from 227 to 3,059, and the clicks recorded against them rose from six to 184. If I were reviewing a young content site each month, I would pay close attention to whether more relevant searches were moving into that range.
Meanwhile, the group at position 21 or worse barely changed in size: 2,695 queries in July and 2,572 in September. Growth did not mean every low-ranking search improved. The site gained a much larger group of stronger rankings while retaining a long tail of weaker ones.
These band tables need one qualification. They come from the queries Search Console discloses, which are only a portion of the site’s total clicks. I explain that limit below.
Which sections earned clicks
I built the site around related subjects, but they did not all pick up traffic at the same rate.
| Section | July clicks | August clicks | September clicks | Pages by September |
|---|---|---|---|---|
| Fishing locations | 105 | 525 | 873 | 53 |
| Gear and tackle | 19 | 188 | 443 | 28 |
| Techniques | 16 | 121 | 253 | 54 |
| Fish species | 4 | 39 | 191 | 54 |
| Rules and law | 32 | 151 | 142 | 12 |
| From the bank | 14 | 43 | 73 | 26 |
| Knots and rigs | 0 | 15 | 47 | 12 |
Location guides led from the first month. A guide to a named river has a clear subject and plenty of practical questions to answer. The search results I encountered often included forum discussions and club pages; that gave me a useful sense of what information an organised guide should cover. I cannot tell from this export alone how much that explains the section’s performance.
Gear and tackle grew from 19 clicks in July to 443 in September. Fish species started more slowly, with four clicks in July, then reached 191 in September across 54 pages. I suspect those pages took longer because they faced well-established coverage of common species, but that is my interpretation, not a finding Search Console can prove.
Rules and law behaved differently. It rose to 151 clicks in August, then slipped to 142 in September while the other sections shown here continued to grow. It also contains a page with one of the site’s largest impression counts. The guide about whether children need a fishing licence recorded 23,091 impressions and 68 clicks, a click-through rate below 0.3%.
That is a useful reminder for anyone reporting on a new site: a page can appear frequently without bringing much traffic. A search about fishing licence rules may be answered directly in the results, and official sources are prominent. I saw an AI Overview for this question citing GOV.UK and the Angling Trust. The export does not establish exactly why each person did or did not click.
The seasonal pages caught my eye
Some of the strongest click-through rates came from a small set of autumn guides published at the root of the site, outside the main section structure.
| Page | Clicks | Impressions | Average position | Click-through rate |
|---|---|---|---|---|
| Autumn tench fishing UK | 43 | 455 | 3.5 | 9.5% |
| Autumn pike fishing UK | 41 | 1,358 | 4.3 | 3.0% |
| Autumn perch fishing UK | 23 | 1,130 | 4.7 | 2.0% |
| Autumn bass fishing UK | 17 | 429 | 4.7 | 4.0% |
The autumn tench guide is the clearest example. It received 43 clicks from 455 impressions, while the children’s fishing licence guide received 68 clicks from 23,091 impressions. The licence page reached far more search results; the tench page got a much larger share of people to visit.
I think timing helped the autumn guides. They were available as interest in autumn fishing arrived, and the searches are more specific than broad species questions. Search Console does not show me the competing pages each searcher saw, so I would treat that as a working explanation rather than a proven cause.
For another business, the useful question is whether its customers have a calendar of their own. If they do, publishing shortly before a seasonal peak gives a page time to be found. These results do not establish a precise number of weeks of lead time, but they have made me more attentive to it.
The individual pages bringing in traffic
The leading pages were largely river guides, alongside one explanation of fishing tackle.
| Page | Clicks | Impressions | Average position |
|---|---|---|---|
| River Severn fishing guide | 257 | 9,901 | 6.9 |
| River Thames fishing guide | 242 | 12,200 | 7.0 |
| River Great Ouse fishing guide | 205 | 5,296 | 6.2 |
| Fishing rod test curve explained | 183 | 14,312 | 6.2 |
| Grand Union Canal fishing guide | 102 | 3,556 | 6.8 |
| Hampshire Avon fishing guide | 100 | 2,402 | 8.2 |
| Do children need a fishing licence | 68 | 23,091 | 7.9 |
All seven pages averaged positions between 6.2 and 8.2 over the measured period. That helps explain why the wider growth in positions four to ten mattered: pages in that range were bringing in visitors.
It also shows why I would not use impressions alone to pick a winner. The licence guide had the most impressions in this table and the fewest clicks.
A first-place result and an AI Overview citation
On 28 September, I checked the live results on google.co.uk for “fishing rod test curve explained” with personalisation off. River Bend appeared as the first organic result, above CPS Tackle, Korda, barbel.co.uk and etackle. The search also returned an AI Overview that cited theriverbend.co.uk on the explanation of what a test curve measures.
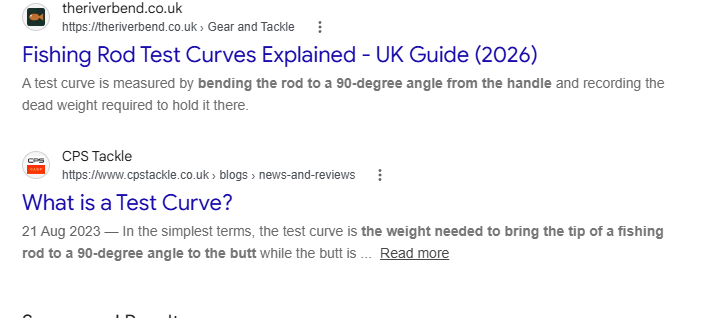
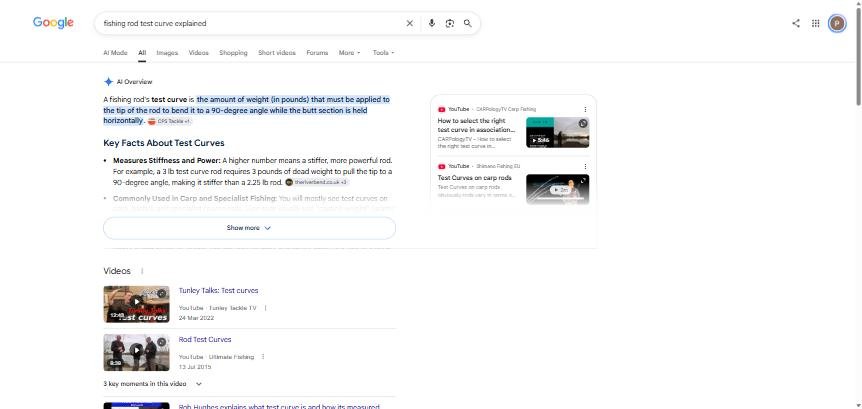
I was pleased to see it, but it is one search checked on one day. Results and AI Overviews can differ between people and between searches. The observation establishes that the page appeared there when I checked; it does not tell me when the citation began or how many visits it produced.
I had written a direct explanation near the top of the guide. It seems plausible that a clear answer helped make the page useful for that result, but I cannot attribute the citation to a particular sentence or piece of markup.
The fishing licence search showed the other side of it. Its AI Overview cited GOV.UK and the Angling Trust, not River Bend. The site also appeared behind gov.uk, Facebook, the Angling Trust, the Canal & River Trust and fisheries.co.uk in the result I checked. For a question about the law, those official sources are understandably difficult company.
What Search Console now shows about AI appearances
While pulling these figures I found a report I had not expected: Search Console has added a Generative AI features section, marked Beta, under Performance.
For the three months shown, it records 71,000 impressions from Google’s generative AI features. The site’s total impressions over a similar window were 340,426, so a meaningful share of the site’s exposure is happening inside AI features instead of the ordinary results.
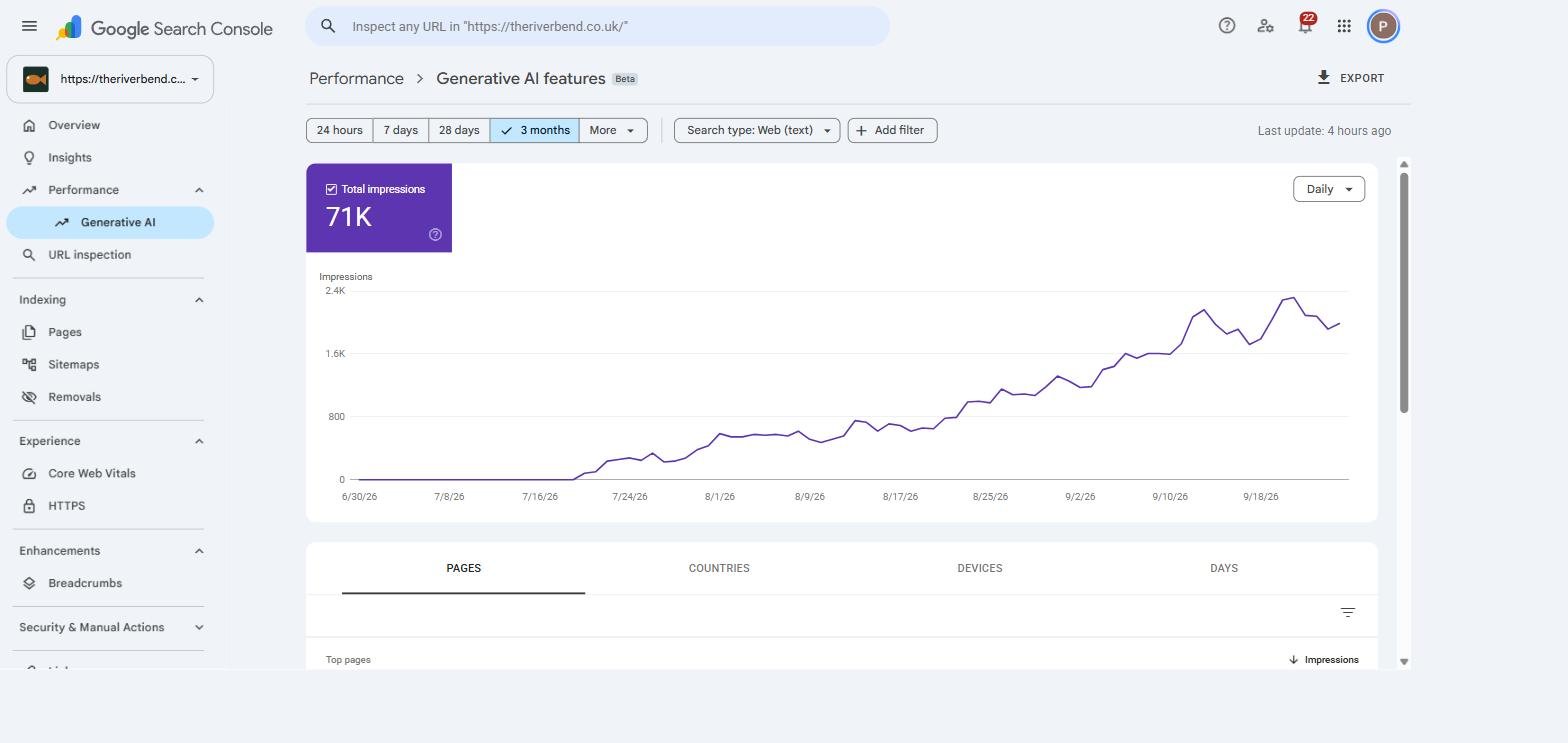
The page breakdown is the part I found most useful, because it does not match the click leaderboard at all.
| Page | AI feature impressions |
|---|---|
| /rules-and-law/fishing-licence/ | 6,635 |
| /fishing-locations/river-thames-fishing-guide/ | 4,531 |
| /rules-and-law/do-children-need-a-fishing-licence/ | 3,266 |
| /gear-and-tackle/fishing-rod-test-curve-explained/ | 3,160 |
| /fishing-locations/river-severn-fishing-guide/ | 2,317 |
| /rules-and-law/crayfish-regulations-uk/ | 1,974 |
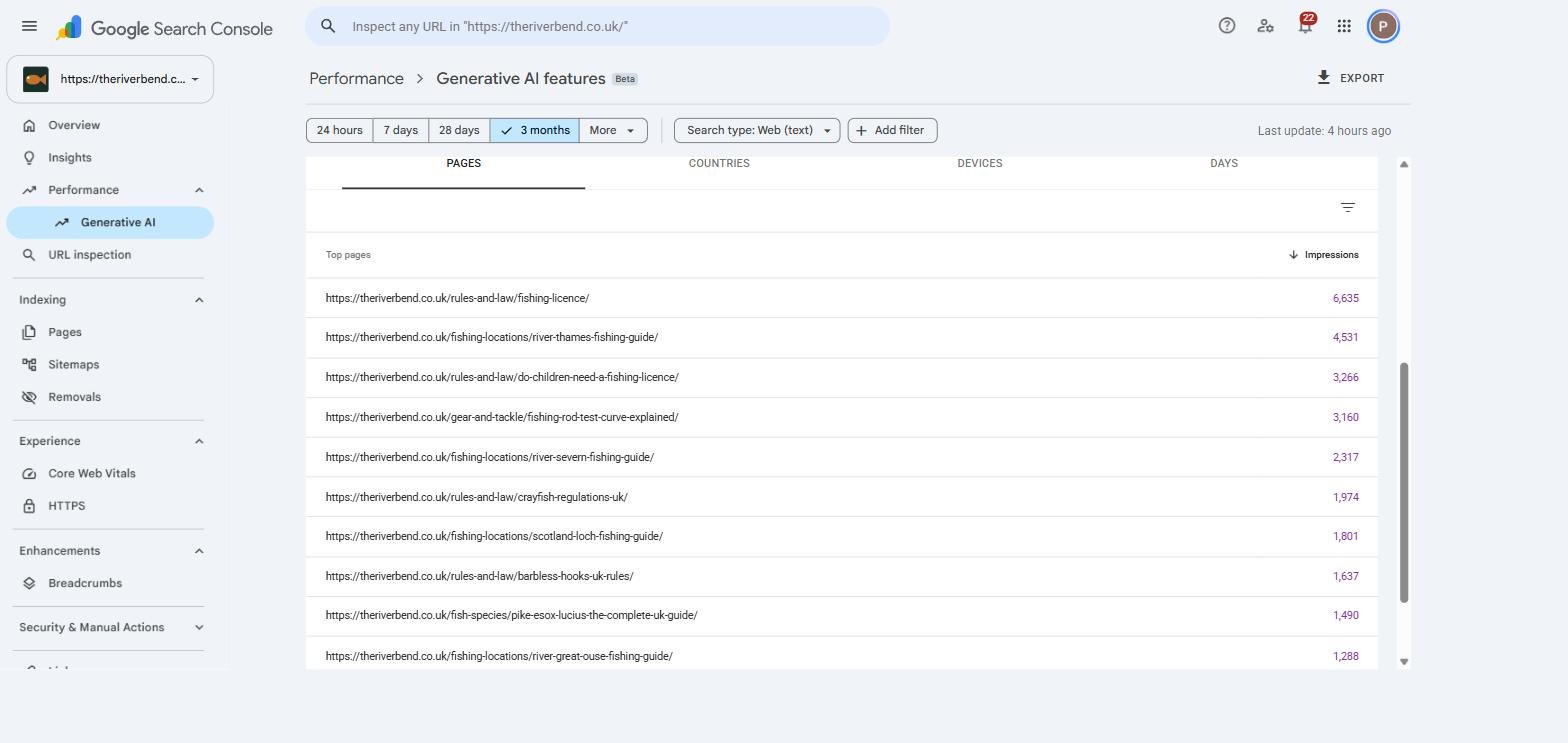
Four of the top six are rules and law pages. That is the section which earned the fewest clicks per impression and the only one whose clicks fell between August and September.
Those two facts fit together, though I would put it no more strongly than that. The rules pages answer factual questions with definite answers, which is the kind of question Google’s AI features handle directly. Being shown inside an AI answer is not the same as being clicked, and the licence guide’s click-through rate below 0.3% is consistent with that. The report tells me the impressions happened. It does not tell me what the reader did next, and I cannot prove the AI feature caused the low click rate.
Two practical limits are worth stating. The report is marked Beta, so the figures and the interface may change. And it is not available through the Search Console API at the time of writing, only in the interface, so these numbers come from the screen and not from an export I can reconcile against the rest.
If you want to know whether AI features are affecting your own site, this report is the place to look, and it did not exist in a usable form a year ago.
What the query data leaves out
There is a limitation to the keyword figures throughout this article. Search Console does not disclose every query. Some rare searches are withheld for privacy.
The query rows in my export add up to 388 clicks and 82,730 impressions. The site totals for the same stated period are 3,749 clicks and 340,426 impressions. In other words, the listed query rows account for roughly a tenth of the clicks. They are useful for understanding the searches I can see, but they are not a complete explanation of the site’s traffic.
That is why I put more weight on the page and section figures when describing where visits went.
An average position over a period has a different limitation: it is not a promise about today’s ranking. Search Console reported an 88-day average position of 2.3 for “signal crayfish”. When I checked live on 28 September, River Bend was not among the top nine domains I saw. The historical average and the live observation can both be accurate because they describe different things.
No disclosed query accounts for much traffic on its own
These were the largest individual queries by clicks in the query export.
| Query | Clicks | Impressions | Average position |
|---|---|---|---|
| ghost carp | 7 | 1,634 | 8.2 |
| butterstone loch fishing | 6 | 71 | 3.9 |
| hampshire avon barbel fishing | 6 | 37 | 3.6 |
| are barbed hooks illegal uk | 5 | 391 | 5.3 |
| best carp rods | 4 | 174 | 31.6 |
| grafham water fishing | 4 | 563 | 10.3 |
| pike fishing september | 4 | 15 | 2.8 |
The largest disclosed query brought seven clicks. Seeing that beside a site total of 3,749 was a useful check on how misleading a short keyword report could be. A lot of the traffic is associated with queries the export does not name.
I would be cautious about drawing a stronger conclusion from the missing rows. They tell me the disclosed table is incomplete; they do not let me reconstruct every search behind the remaining clicks.
The visible examples still say something about planning. “Best carp rods” sounds like the kind of term a keyword tool might draw attention to, yet this site averaged position 31.6 for it and received four clicks. “Butterstone loch fishing” brought six clicks from 71 impressions at an average position of 3.9. I would not build an entire site from either example. They did reinforce my decision to make guides genuinely useful for particular places and questions, rather than pursue only the largest-looking terms.
Rich results, Discover and News
Product snippets were the search appearance type shown in the export: 64 clicks, 6,821 impressions and an average position of 18.1. They relate to the gear content and its markup.
Google Discover and Google News returned no data for the period. I had not built this fishing site around News, but Discover is sometimes treated as an expected source of traffic for content sites. It contributed nothing in these first months. I would not put it into a new site’s traffic forecast until there was evidence that the site was receiving visits from it.
What I would repeat, and what I would change
I would keep the publishing process. Having the title, description, category and markup attached when a guide went live made it practical to publish a substantial site without a separate round of page-by-page tidying. I cannot prove it produced the rankings, but it saved work and kept the pages consistent.
I would also keep the focus on specific guides. Location pages brought clicks from the first month and continued to lead. Named rivers gave me room to answer concrete questions, which felt more useful than trying to write one broad guide to fishing everywhere.
I would check internal links after every publishing batch. One audit found eleven gear guides that appeared in neither the gear hub nor its menu. Expanding the menu from three columns to four brought all 22 gear pages into it, and I now run the check after each batch. It was a small error that was easy to miss while concentrating on the content itself.
I would also check the URLs themselves. Preparing this article turned up eight guides published under two misspelled section paths sitting alongside the correct one. They had been collecting impressions on the wrong URLs for weeks. That is the same class of mistake as the orphaned pages: invisible while the content looks fine.
I would start the species guides earlier. They were almost the last section I worked on and took longer to build traffic than the location pages. That does not prove they needed more time in Google, but it makes me wonder what their September figures would have looked like with an earlier start.
I would give seasonal guides more lead time as well. The autumn pages performed strongly even though they went live relatively close to the season. Whether an extra month would have improved them is a question, not a result I can claim. The winter guides will give me another chance to observe it.
Finally, I would begin recording AI citations from launch. A citation I can see today is interesting; without earlier checks, I cannot say when it first appeared or whether it has been consistent. The Generative AI features report helps with that from now on, but it cannot tell me about the months before I looked.
What these 88 days show
From 2 July to 25 September 2026, Search Console recorded 340,426 impressions and 3,749 clicks for River Bend, a new UK fishing site. The reported monthly average position improved from 19.9 in July to 9.1 in the September period. The site had five branded queries producing seven clicks across the full period, so branded search was a very small part of the recorded traffic.
That is a stronger start than I would tell a small business owner to assume. It is also a result with limits.
The data cannot isolate why it happened. The content, site structure, internal links, technical setup and publishing process were all in place together. There was no comparison site where I changed one element at a time.
This was my own project, so its pace does not transfer neatly to a client site with approvals, competing priorities or fewer resources. The period also ran from summer into early autumn in a seasonal subject. We do not yet know what happens through winter.
There are no revenue figures in this case study. The site contains affiliate links, but clicks from Google are not earnings. And 88 days is an early result: the site could keep growing, level off or lose visibility.
If you are launching a site, I would take the sequence more seriously than the headline total. Pages began appearing quickly. Clicks were scarce at first. More of the useful rankings developed over the following months. Your sequence and numbers may be quite different, but separating those stages will help you judge what is actually happening.
The shorter version, framed around how the site was built, is on the River Bend case study page.
What I will watch next
I will keep watching how many relevant queries appear in positions four to ten, and whether the pages in that range continue to earn clicks. I will also watch the seasonal guides through winter. That should help me judge how much of the early growth persists when fishing demand changes.
The Generative AI features report gives me something new to track as well: whether that 71,000 impressions keeps growing, and whether the rules and law pages continue to dominate it while earning few clicks.
I plan to update the same figures at six months. By then I should have a better view of whether this was the beginning of sustained growth or a particularly strong summer-to-autumn start.
FAQ
How long does a new website take to get traffic from Google?
River Bend first appeared in Google Search Console two days after I registered the domain and received its first clicks on 6 July 2026. It then recorded 202 clicks in July, 1,145 in August and 2,402 in the September period through the 25th. That is one site’s experience, not a standard waiting time. Its pages gained visibility before they gained many clicks.
Does a new site need backlinks before it can rank?
River Bend reached 340,426 impressions in its first 88 days without a link-building campaign. That shows a campaign was not necessary for this site to start appearing and earning clicks. It does not establish that the site had no links at all, or that links would make no difference to more competitive searches.
Why did average position get worse while traffic grew?
In River Bend’s first two weeks, average position moved from 18.6 to 23.0 while impressions rose from 1,071 to 5,370 and clicks from 11 to 43. The site was appearing for many more queries, including ones where it ranked further down. An overall average can worsen as the set of searches expands.
Why might a page get impressions but few clicks?
Ranking position is one possible reason. In River Bend’s July query export, 2,695 queries averaged position 21 or worse and produced two clicks. The type of question matters too: the children’s fishing licence guide had 23,091 impressions and 68 clicks, and it is among the site’s most-shown pages in Search Console’s Generative AI features report. The data does not identify the reason for every missed click.
Can I see AI Overview impressions in Search Console?
There is now a Generative AI features report under Performance, marked Beta, which showed 71,000 impressions for River Bend across three months. It was not available through the Search Console API when I looked, only in the interface, and Beta means it may change.
Can a new site appear in an AI Overview?
Yes. When I checked google.co.uk on 28 September 2026, River Bend was cited in the AI Overview for “fishing rod test curve explained”. That is a verified observation for one query at one time.
Is WordPress suitable for a search-focused site?
It worked for this project. WordPress let me publish guides with the URLs, metadata, categories and markup I wanted, and connect them through the site’s hubs and menus. The platform itself does not explain the results, but it did not prevent me from building the structure I had planned.
Sources and method
- Search Console performance data for
https://theriverbend.co.uk/, owner access, pulled 28 September 2026. The measured window runs from domain registration on 30 June to 25 September 2026, which is 88 days. Data after 25 September was not yet complete when the export was taken and is excluded. - Period figures use the date dimension. Page and section figures use the page dimension. Rank-band and query figures use the query dimension and therefore describe only the queries Search Console discloses, which totalled 388 clicks of the site’s 3,749.
- Generative AI features figures are read from the Search Console interface on 28 September 2026. That report is marked Beta and was not exposed through the API at the time.
- Live result checks on google.co.uk, 28 September 2026, with personalisation disabled and UK settings, for “fishing rod test curve explained”, “do children need a fishing licence” and “signal crayfish”. Single checks on one day.
- Full extract, the period cuts and an explicit list of what the data does and does not support are kept in the project research folder.