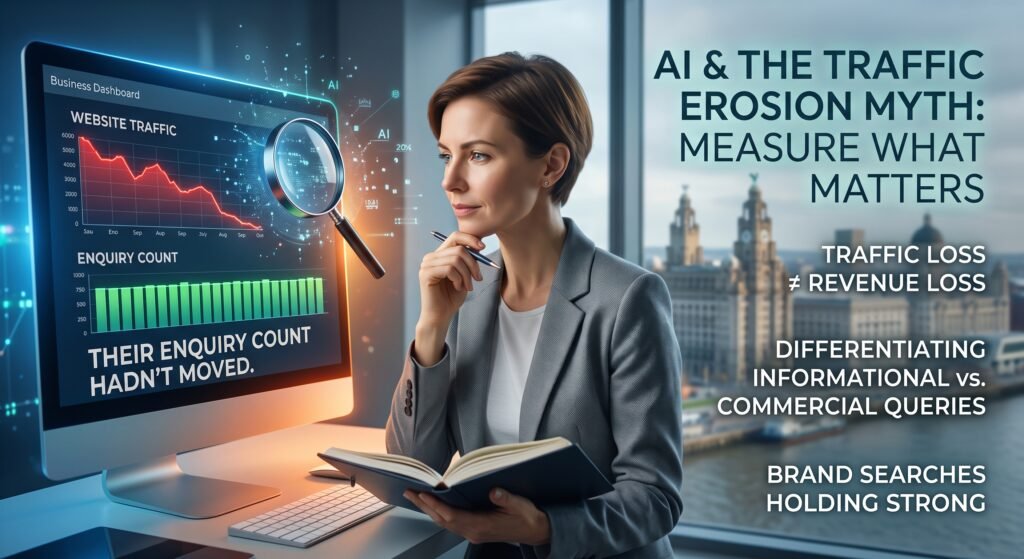
A business owner I spoke to this year had lost about a fifth of their organic traffic over eighteen months and their enquiry count hadn’t moved. They were understandably confused about whether they had a problem.
That situation is becoming more common, and it’s worth thinking through properly, because the instinct is to treat any traffic decline as damage. Sometimes it is. Sometimes the traffic that left was never going to buy anything, and losing it costs you a number on a dashboard and nothing else.
This piece is about telling those apart. It deals with consequences and leaves the mechanism alone, so if you want how AI answers get built, what AI Overviews actually are covers that, and the measurement method is in measuring whether AI search is costing you traffic.
Not all queries are affected equally
The single most useful thing to understand is that the effect concentrates in particular kinds of search.
Research published in August 2026, analysing browsing data from a US panel of 900 adults, found that AI Overviews were more likely to appear on longer queries, queries beginning with question words, and queries containing both nouns and verbs. In other words, questions. The same body of work found a traditional result was clicked in 8% of searches where an AI summary appeared, against 15% where one didn’t.
That’s US data from a 900-person panel, so I’d treat the direction as more reliable than the figures. But the pattern it describes matches what I see in client Search Console data: guides and explainers take the hit, commercial and brand pages mostly don’t.
My own spot check on five UK commercial searches in September 2026 found the same boundary in a different form. Three product-comparison searches produced AI Overviews. One local service search, “commercial cleaning services Liverpool”, produced none at all, just a map pack and ordinary results. Five queries on one day proves nothing on its own, but it points the same way.
So before assuming you’re affected, look at what your enquiries actually come from. A business whose customers search “emergency plumber Wirral” is in a different position from one whose customers search “how much does a bathroom refit cost”.
Why brand and commercial searches behave differently
Somebody searching your business name has already decided where they’re going. An AI summary above the result doesn’t change the destination, and in my experience brand queries hold up almost completely.
Commercial searches with clear intent behave similarly, because the searcher wants to reach somewhere and do something. A summary can describe the options; it can’t book the appointment or take the order.
Informational searches are where the erosion happens, and there’s a reasonable logic to it. If somebody wants to know what an expansion gap is, or roughly what a website costs, a 200 word answer genuinely serves them. They were never going to fill in your contact form on that visit.
This is uncomfortable if your content strategy was built on capturing that audience early and nurturing them. That model still works, but the top of it has narrowed, and I think it’s worth saying plainly that some of what we all built in the last decade was traffic that looked like marketing and was really just traffic.
The part that genuinely is a problem
I don’t want to be glib about this, because there are real losses.
Publishers and anyone whose model is advertising-funded are straightforwardly worse off when fewer people arrive. There’s no reframing that helps. The traffic was the product.
Businesses whose enquiries genuinely started with an informational search are affected too. Some sectors work that way: professional services where someone reads three guides before calling anyone, or considered purchases with a long research phase. If your analytics shows people reading two or three articles before enquiring, the top of that path getting thinner will show up in enquiries eventually, on a lag.
And businesses that were relying on volume to cover a weak conversion rate are exposed, because less traffic makes an existing problem visible.
What I’d say to all three: the diagnosis has to come from your own data, not from an industry figure. The 8% against 15% number describes a US panel, not your business.
What to measure when traffic stops being the goal
If clicks are becoming a less reliable measure, the answer isn’t to stop measuring. It’s to measure closer to the money.
Enquiries and sales from organic, tracked properly. This should always have been the primary measure and for a lot of small businesses it never was, because traffic was easier to report.
Assisted conversions and the paths into them, so you can see whether the research-phase content is still contributing even as its own traffic falls.
Branded search volume, which is a decent proxy for whether people are hearing about you. If your informational traffic falls while brand searches rise, something is working that clicks aren’t capturing.
Whether assistants name you for the questions your customers ask. That’s manual testing, monthly, recorded over time. It’s the closest thing to a visibility measure for the part of the funnel that no longer produces a click.
Impressions, treated as a visibility signal in their own right. If impressions hold while clicks fall, you’re still being shown. That’s not nothing, and it’s the difference between a presence problem and a click-through problem.
The content that still earns the click
Across the client work I’ve done this year, the pages holding their click-through share have something in common. They contain information a 200 word summary cannot compress.
Specific prices that depend on circumstances. Local detail. First-hand accounts of doing the thing. Photographs of actual work. Data the business collected itself. Anything where the answer is “it depends, and here’s what it depends on”.
That aligns with what Google’s own guidance points at, which emphasises first-hand perspective and content that isn’t recycled. It also aligns with the GEO research from 2023, which found that adding citations, statistics and quotations improved how often content was used as a source in the systems tested. Different question, same direction.
I’d be careful not to overclaim from that alignment. Google’s guidance is about what helps content perform, not a promise about clicks, and the GEO research tested its own benchmark rather than Google. The honest version is that specific, evidenced content is harder to summarise away, which seems reasonable on its face and is supported from a couple of directions.
What I’d do
Work out which of your queries are actually informational. Search Console, sorted by impressions, looking at the query text. Most people are surprised by how much of their traffic was never commercial.
Then check whether your enquiries have moved. If traffic fell and enquiries held, you’ve lost audience you weren’t converting, and the right response is proportionate.
If enquiries have fallen too, work backwards through the path rather than assuming the cause. Check position before concluding anything, because ranking movements look identical to AI losses in a traffic graph.
Then decide, page by page, which informational content is worth defending. A page answering a genuinely compressible question probably isn’t. A page carrying your own data, prices or experience probably is, and strengthening it is the better use of the same hours.
I do this analysis with clients and the most common outcome is not what people expect: a smaller number of pages genuinely at risk than feared, and a conversion rate problem that was always there. There’s more on that at AI search visibility.
FAQ
Is AI search killing organic traffic for small businesses?
Not uniformly. Published research suggests the effect concentrates on informational and question-shaped searches. Brand searches and commercial searches with clear intent hold up much better, and some local commercial searches still show no AI answer at all. Which category your enquiries come from decides how exposed you are.
My traffic is down but enquiries are flat. Should I worry?
Probably less than you think. That pattern usually means the traffic you lost was early-stage and wasn’t converting. It’s worth checking whether research-phase content still contributes through assisted conversions, but measure the enquiries before you change anything.
Which pages lose clicks to AI answers?
Pages answering questions that can be summarised in a couple of hundred words. Definitions, general cost ranges, straightforward how-to steps. Pages carrying specifics, local detail, your own data or first-hand experience are harder to compress and tend to hold their click-through better.
What should I measure instead of traffic?
Enquiries and sales from organic first, which should always have been primary. Then assisted conversions, branded search volume as a proxy for awareness, whether assistants name you for your customers’ questions, and impressions as a visibility signal separate from clicks.
Do brand searches get affected by AI Overviews?
Much less. Someone searching your business name has already chosen their destination, and a summary above the result rarely changes that. In the client data I see, brand queries hold up close to completely, which is one reason brand search volume is a useful measure when click data gets noisy.
Sources and method
- Investigating Click Behaviors On Google Search Result Pages That Produce an AI Overview, Chapekis, Lieb, Shah and Smith, arXiv:2608.04831, submitted 5 August 2026, accessed 24 September 2026. Query characteristics that predict an AI Overview, and the association with fewer clicks. US panel of 900 adults, March 2025 browsing data.
- Google users are less likely to click on links when an AI summary appears in the results, Pew Research Center, published 22 July 2025, accessed 24 September 2026. The 8% against 15% click figures from the same panel.
- Top ways to ensure your content performs well in Google’s AI experiences on Search, Google Search Central, last updated 10 July 2026, accessed 24 September 2026. Google’s emphasis on first-hand perspective and content that isn’t recycled.
- GEO: Generative Engine Optimization, Aggarwal and colleagues, arXiv:2311.09735, accepted to KDD 2024, accessed 24 September 2026. The finding that citations, statistics and quotations improved visibility in the systems tested, which were the authors’ own benchmark and not Google.
- Own spot check: five live UK commercial Google searches captured 24 September 2026, including one local service query that returned no AI Overview. Raw captures and method are in the project research folder.
On the client observations. Where I’ve described patterns in client Search Console data, that’s my own observation across a small number of UK small business accounts, not a study. It’s offered as what I see, and it should be weighed accordingly.